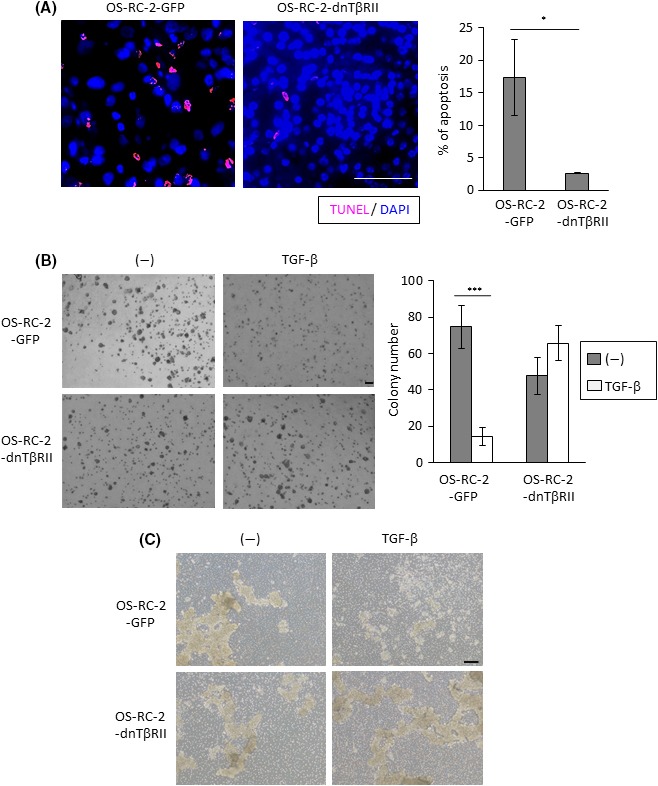
Figure 6.

Induction of apoptosis of clear cell renal carcinoma (ccRCC) cells by transforming growth factor beta (TGF‐β). A, Apoptosis in primary tumor tissues dissected from mice shown in Figure 4D, which were killed 3 wks after the transplantation. Left panels: tumor tissues were subjected to TUNEL staining. Representative images were captured for tissue from each mouse. Right panel: apoptosis was quantified by counting the number of TUNEL‐positive cells in three independent fields; data represent the mean ± SD. *P < .05. Scale bar is 50 μm. B, Colony formation of indicated cells in soft agar. Cells were stimulated with or without TGF‐β for 14 d. Left panels: Representative photographs. Right panel: colony number was counted in three independent fields; data represent the mean ± SD. ***P < .001. Scale bar is 200 μm. C, Colony formation of indicated cells in detached culture. Cells were stimulated with or without TGF‐β for 2 d. Representative photographs are shown. Scale bar is 200 μm
