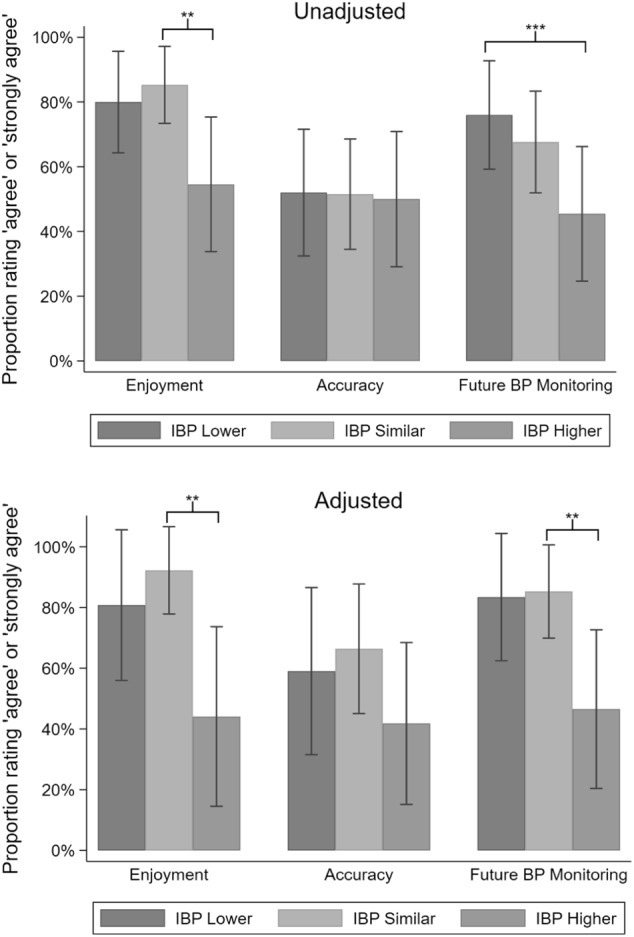
Fig. 2.

Proportion rating “agree” or “strongly agree” for each domain in the survey, unadjusted and adjusted models*. *The bars indicate a 95% confidence interval surrounding the point estimate of proportions. The adjusted model accounts for age, sex, race, level of education, history of hypertension, receipt of antihypertensives, smartphone ownership, and history of mHealth app ownership. Proportions were converted from odds and were not bounded to 100%. Two stars indicates that the IBP Similar group is significantly different from the IBP Higher group. Three stars indicates that the IBP Lower group is significantly different from the IBP Higher group
