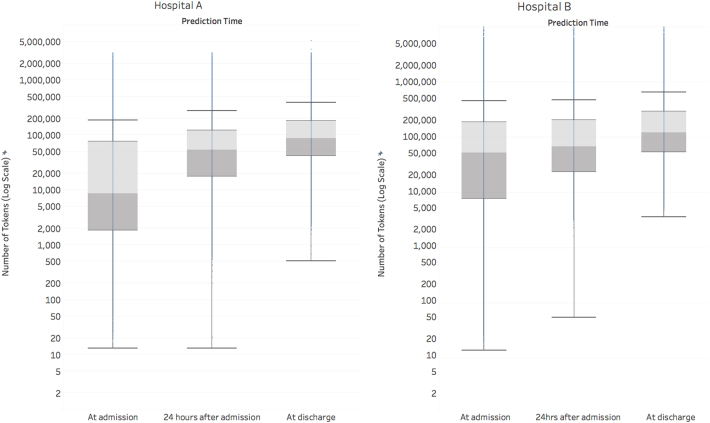
Fig. 1.
This boxplot displays the amount of data (on a log scale) in the EHR, along with its temporal variation across the course of an admission. We define a token as a single data element in the electronic health record, like a medication name, at a specific point in time. Each token is considered as a potential predictor by the deep learning model. The line within the boxplot represents the median, the box represents the interquartile range (IQR), and the whiskers are 1.5 times the IQR. The number of tokens increased steadily from admission to discharge. At discharge, the median number of tokens for Hospital A was 86,477 and for Hospital B was 122,961

