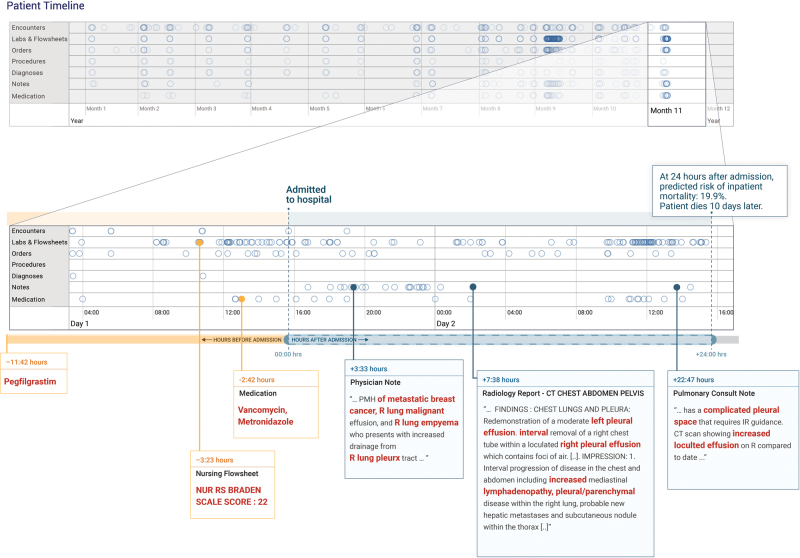
Fig. 3.
The patient record shows a woman with metastatic breast cancer with malignant pleural effusions and empyema. The patient timeline at the top of the figure contains circles for every time-step for which at least a single token exists for the patient, and the horizontal lines show the data type. There is a close-up view of the most recent data points immediately preceding a prediction made 24 h after admission. We trained models for each data type and highlighted in red the tokens which the models attended to—the non-highlighted text was not attended to but is shown for context. The models pick up features in the medications, nursing flowsheets, and clinical notes relevant to the prediction

