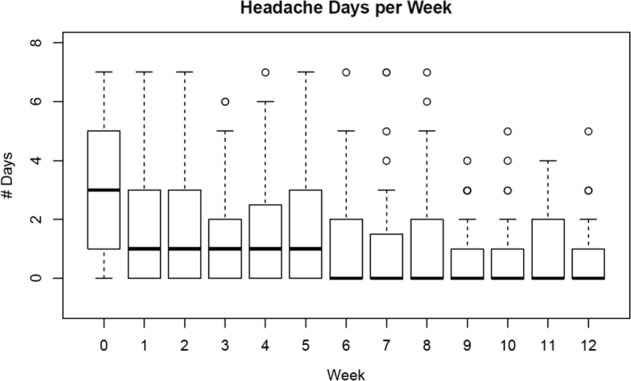
Fig. 3.

Headache days reported per week. Boxplots of distribution of headache days reported each week since enrollment for participants who used the diary in the corresponding week. Week 0 is the week of enrollment. For each boxplot, the solid dark center line represents the median, the bounds of the box are given by the first quartile (Q1) and the third quartile (Q3), and the whiskers are bounded by (Q1 − 1.5 × IQR, Q3 + 1.5 × IQR). The points outside the whiskers are the outliers
