
Figure 3.
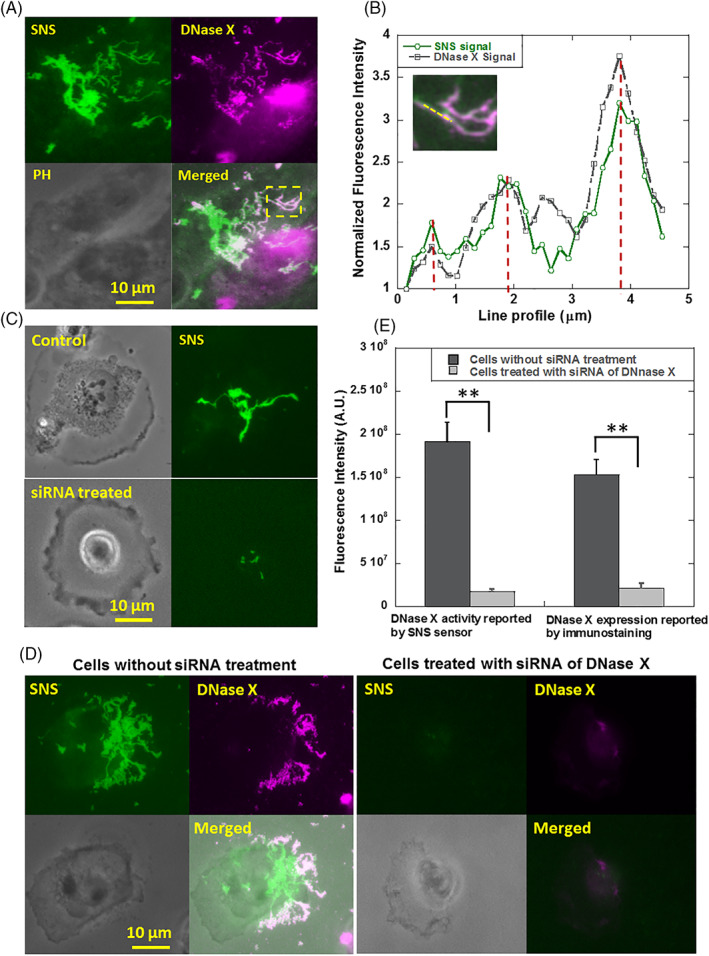
The MN in MDA‐MB‐231 cells was identified as DNase X. (A) Images of MN activity and cell structure immunostained by anti‐DNase X. (B). Line profile analysis of the images (marked by a yellow line) shows the co‐localization of MN activity and DNase X. (C) MN activities in control cells and cells treated with siRNA of DNase X. (D) MN activity and DNase X expression level in MDA‐MB‐231 cells reported by SNS sensor and DNase X immunostaining, respectively. Cells were pre‐treated with siRNA of DNase X. The control group of cells were treated with transfection reagent without siRNA. (E) Treatment with siRNA of DNase X significantly reduced both MN activity and DNase X expression level on the cell membrane