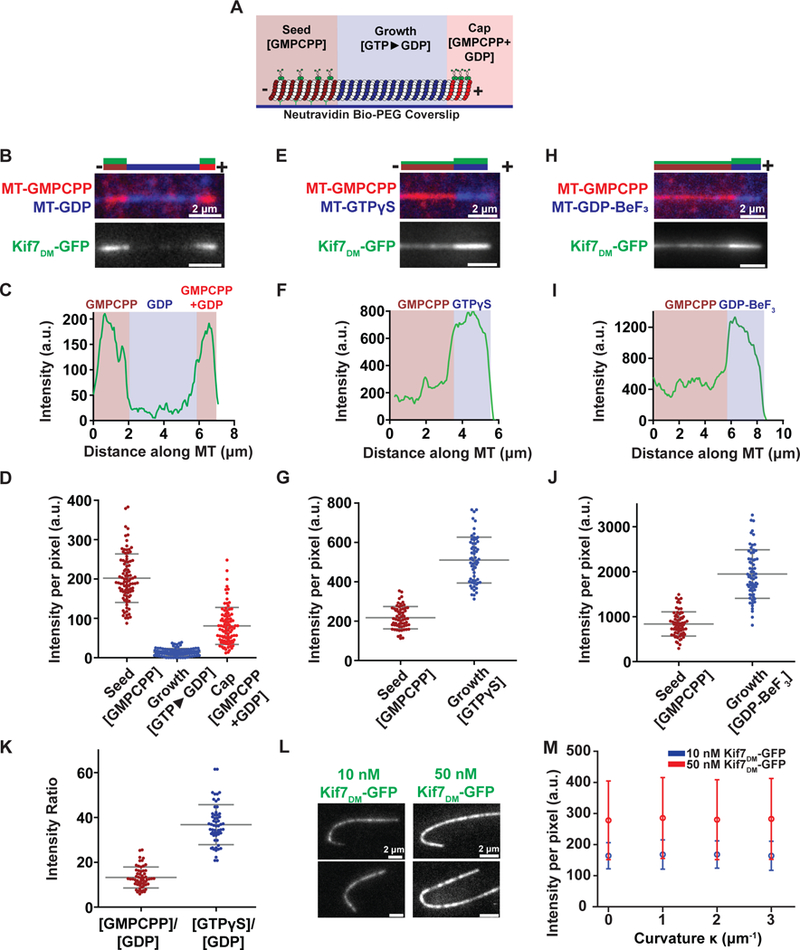
Figure 1. Kif7 preferentially binds GTP- over GDP-tubulin. See also Figure S1.

A. Schematic of the segmentation assay used to examine Kif7DM-GFP binding to microtubule segments in different nucleotide states. X-rhodamine-labeled GMPCPP-stabilized microtubule ‘seeds’ (brown) were immobilized on a glass coverslip via a neutravidin-biotin linkage. Microtubule polymerization was initiated by incubating the seeds with HiLyte647 tubulin (blue) and either 1 mM GTP, 1 mM GTPγS or 2 mM GDP-BeF3 (2 mM GTP, 2 mM BeSO4 and 10 mM NaF). The growing microtubules were stably capped by further polymerization in the presence of X-rhodamine-labeled tubulin and a mixture of 2 mM GMPCPP and 1 mM GTP (red). Kif7DM-GFP (green) and 1 mM ATP were subsequently added to examine the association of Kif7.
B. Representative image of microtubule (top) and associated Kif7DM-GFP (bottom) obtained from the experiment described in (A). Assay conditions: 150 nM Kif7DM-GFP and 1 mM ATP and GTP. The schematic above the image indicates the position of the seed (brown), growth (blue), cap (red) and the associated Kif7DM-GFP signal (green).
C. Line scan of GFP intensity from Kif7DM-GFP bound to the microtubule shown in (B).
D. Scatter plot of GFP fluorescence intensity per pixel on the GMPCPP seed (brown), GTP►GDP growth (blue) and GMPCPP+GDP cap (red). Error bars represent standard deviation. Assay conditions: 150 nM Kif7DM-GFP and 1 mM ATP (GMPCPP-seed: I = 202.3 ± 61.7; N = 93, GDP growth: I = 14.1 ± 9.3; N = 93 and GMPCPP+GDP cap: (I = 80.8 ± 47.0; N = 93).
E. Representative image of microtubule (top) and associated Kif7DM-GFP (bottom) obtained from the segmentation assay. Experimental conditions: 150 nM Kif7DM-GFP, 1 mM ATP and 1 mM GTPγS. The schematic above the image indicates the position of the seed (brown), growth (blue) and the associated Kif7DM-GFP signal (green).
F. Line scan of GFP intensity from Kif7DM-GFP bound to the microtubule shown in (E).
G. Scatter plot of GFP fluorescence intensity per pixel on the GMPCPP-seed (brown) and GTPγS growth segment (blue). Error bars represent standard deviation. Assay conditions: 150 nM Kif7DM-GFP and 1 mM ATP. (GMPCPP seed: I = 217.9 ± 56.7; N = 63 and GTPγS growth: I = 510.6 ± 116.6; N = 63).
H. Representative image of microtubule (top) and associated Kif7DM-GFP (bottom) obtained from the segmentation assay. Experimental conditions: 150 nM Kif7DM-GFP and 1 mM ATP and 2 mM GDP-BeF3. The schematic above the image indicates the position of the GMPCPP seed (brown), GDP-BeF3-growth (blue) and the associated Kif7DM-GFP signal (green).
I. Line scan of GFP intensity from Kif7DM-GFP bound to the microtubule shown in (H).
J. Scatter plot of GFP fluorescence intensity per pixel on the GMPCPP seed (brown) and GDP-BeF3 growth segment (blue). Error bars represent standard deviation. Assay conditions: 150 nM Kif7DM-GFP and 1 mM ATP. (GMPCPP-seed: I = 836.4 ± 270.5; N = 65 and GDP-BeF3 growth: I = 1946.8 ± 540.9; N = 65).
K. Scatter plot of GFP fluorescence intensity ratio between GMPCPP/GDP (brown) and GTPγS/GDP (blue). Error bars represent standard deviation. Assay conditions: 150 nM Kif7DM-GFP and 1 mM ATP. (GMPCPP/GDP: 13.2 ± 4.7 and GTPγS/GDP: 36.8 ± 8.9).
L. Representative images of GFP fluorescence signal from Kif7DM-GFP at 10 nM and 50 nM concentrations in the presence of 1 mM ATP associated on curved microtubules.
M. Plot of Kif7DM-GFP fluorescence intensity against microtubule curvature on GMPCPP microtubules. Error bars represent standard deviation (Kif7DM-GFP 10 nM: |κ0| 164 ± 42, |κ1| 168 ± 47, |κ2| 168 ± 44, |κ3| 164 ± 47; 50 nM: |κ0| 278 ± 126, |κ1| 285 ± 130, |κ2| 280 ± 129, |κ3| 283 ± 130). Assay conditions: 10 nM (blue) and 50 nM (red) Kif7DM-GFP and 1 mM ATP.
