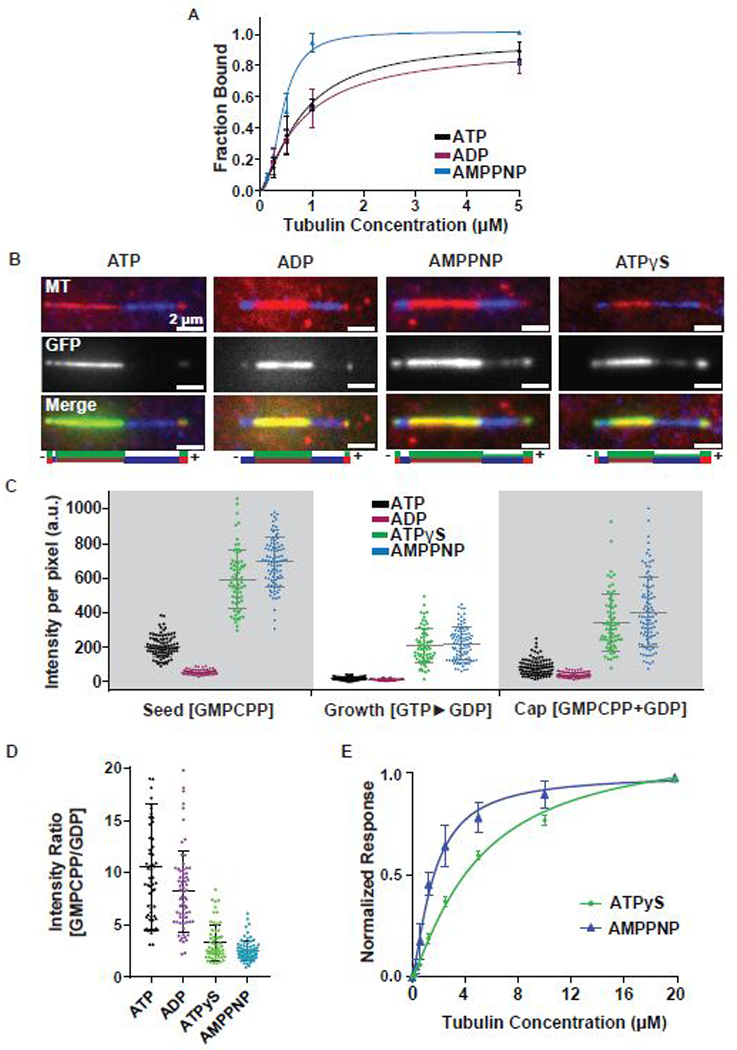
Figure 2. Kif7 ATP hydrolysis enhances GTP- and GDP-tubulin discrimination. See also Figure S2.

A. Cosedimentation assay to quantitatively examine the binding affinity of Kif7DM-GFP (1 μM) to GDP-taxol stabilized microtubules (0–5 μM) in the presence of 1 mM ATP (black) ADP (purple) and AMPPNP (blue). Error bars represent standard deviation. The plots of fraction of Kif7DM-GFP bound versus microtubule concentration were fit to a Hill equation to determine the equilibrium dissociation constants under different nucleotide conditions. (Kd for Kif7DM-GFP, ATP: 0.78 ± 0.10 μM, ADP: 0.81 ± 0.16 μM and AMPPNP: 0.43 ± 0.03 μM).
B. Representative images showing Kif7DM-GFP (150 nM) associated with segmented microtubules composed of the GMPCPP-seed (red), GDP growth (blue) and GMPCPP+GDP cap (red) in the presence of different adenosine nucleotides (1 mM ATP, ADP, AMPPNP and ATPγS). The schematics under the images indicate the position of the seed (brown), growth (blue), cap (red) and the associated Kif7DM-GFP signal (green).
C. Scatter plot of GFP fluorescence intensity per pixel of microtubule-bound Kif7DM-GFP (150 nM) on the indicated microtubule segments. Error bars represent standard deviation. Assay conditions: 150 nM Kif7DM-GFP and 1 mM ATP (black), ADP (purple), AMPPNP (blue), ATPγS (green) on the GMPCPP-seed, GTP►GDP growth and GMPCPP+GDP cap. (GMPCPP-Seed: ATP: 202.3 ± 61.7; N = 93, ADP: 53.0 ± 14.0; N = 65, AMPPNP: 693.4 ± 141.7; N = 93 and ATPγS: 591.5 ± 172.7; N = 68. GDP growth: ATP: 14.1 ± 9.3; N = 93, ADP: 8.6 ± 5.4; N = 65, AMPPNP: 216.5 ± 96.5; N = 93 and ATPγS: 207.6 ± 102.9; N = 68. GMPCPP+GDP cap: 80.8 ± 47.0; N = 93, ADP: 37.1 ± 15.8; N = 65, AMPPNP: 401.2 ± 203.5; N = 93 and ATPγS: 338.2 ± 165.7; N = 68).
D. Scatter plot of the intensity ratio of microtubule-bound Kif7DM-GFP on the GMPCPP-seed and GTP►GDP growth regions in the presence of different adenosine nucleotides. Error bars represent standard deviation. Assays were performed under Kif7DM-GFP concentrations that resulted in similar average fluorescence intensities on the GMPCPP-seed in the presence of different nucleotides to allow for normalization. Assay conditions: 150 nM Kif7DM-GFP and 1 mM ATP; 250 nM Kif7DM-GFP and 1 mM ADP; 10 nM Kif7DM-GFP and 1 mM AMPPNP; 50 nM Kif7DM-GFP and 1 mM ATPγS. (GMPCPP/GDP: ATP: 10.53 ± 6.04; N = 62, ADP: 8.19 ± 3.84; N = 68, AMPPNP: 2.51 ± 0.96; N = 78 and ATPγS: 3.32 ± 1.71; N = 61).
E. Biolayer interferometry assay to quantitatively examine the binding affinity of Kif7DM to soluble tubulin (0–20 μM) in the presence of 1 mM ATPγS (green) and AMPPNP (blue). Error bars represent standard deviation. The plots of fraction of Kif7DM bound versus soluble tubulin concentration were fit to a Hill equation to determine the equilibrium dissociation constants under different nucleotide conditions. (Kd for Kif7DM, ATPγS: 4.98 ± 0.9 μM and AMPPNP: 1.64 ± 0.2 μM).
