
Figure 2.
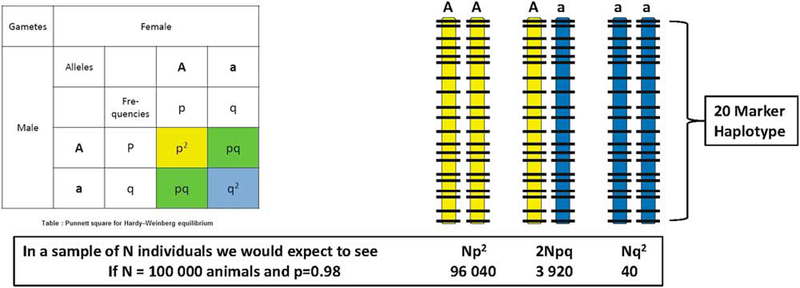
Two haplotypes (coloured yellow or blue) defined by alleles present at 20 consecutive single nucleotide polymorphism markers (locations shown as horizontal bars) are present at frequencies of p = 0.98 and q = 0.02 in a genotyped sample of size N = 100 000 cattle. On average, 40 animals would be expected to be homozygous for the rare (blue) haplotype.