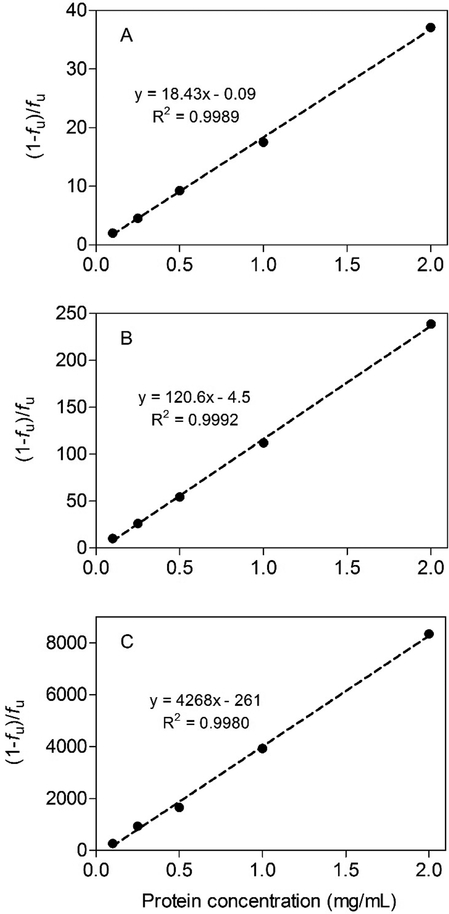
FIG. 6.
Binding of phenanthrene (panel A), pyrene (panel B), and benzo[a]pyrene (panel C) in trout liver S9 fractions. Data are plotted as the bound-to-free ratio ([(1 − fu)/fu] versus S9 protein concentration. Each point represents the mean ± SD of 5 (phenanthrene and pyrene) or 7 (benzo[a]pyrene) independent determinations.

