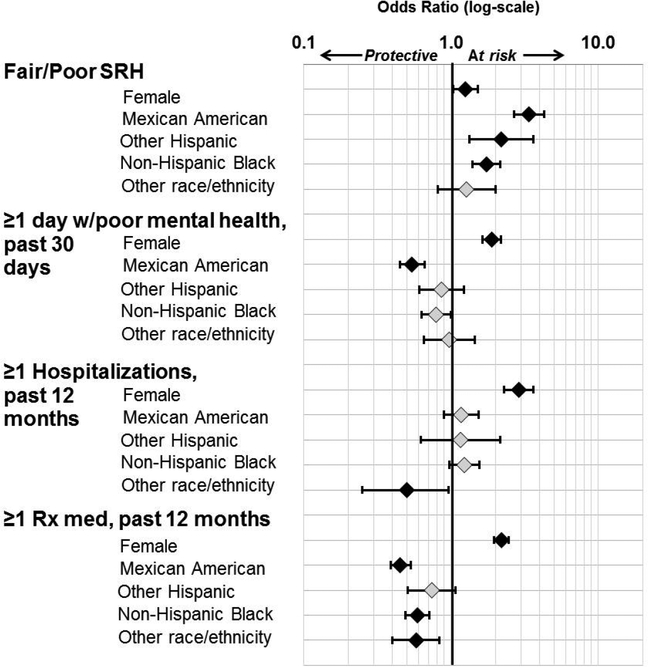
FIGURE 2.
Prevalence odds ratios and 95% CI for socioeconomic indicators for gender (adjusted for race/ethnicity, age, smoking, obesity, and health insurance status) or race/ethnicity (adjusted for gender, age, smoking, obesity, and health insurance status). Female compared to male; racial/ethnic groups compared to non-Hispanic White. Black fill indicates significant at p<0.05.

