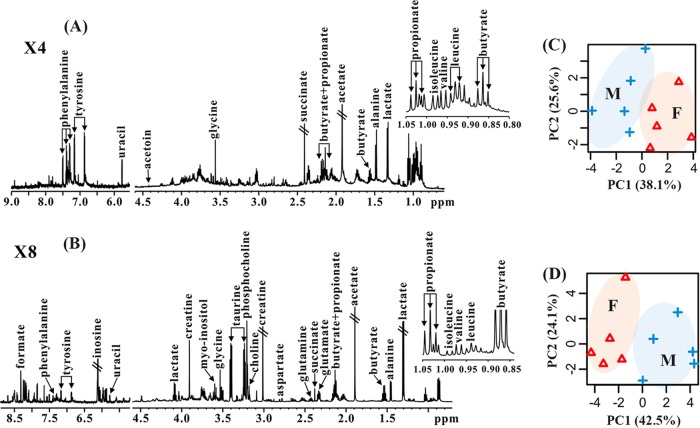
FIG 2.
Sex differences in the metabolomic profile of healthy mice. Typical 600 MHz 1H NMR spectra of colonic contents (A) and colonic tissues (B) of mice are shown. A classification based on PCA was performed using the metabolomic profile in colonic contents (C) and colonic tissues (D) of mice. M, male; F, female. X4, 4 times magnification; X8, 8 times magnification.

