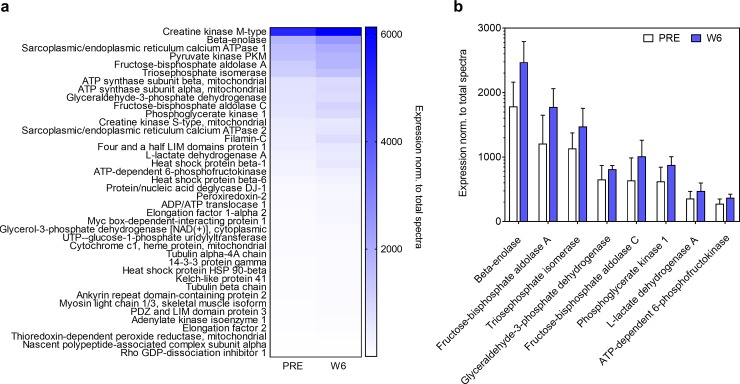
Fig 4. PRE and W6 sarcoplasmic fraction proteomic analysis.
Proteomics analysis was performed by LC-MS/MS on n = 12 participants at PRE and W6. Out of the 157 sarcoplasmic proteins detected using proteomics analysis, 40 proteins were significantly upregulated from PRE to W6 (p<0.05; panel a). KEGG pathway analysis indicated that only one pathway termed glycolysis/gluconeogenesis (8 up-regulated enzymes) was significantly up-regulated from PRE to W6 (panel b). Data in panel b are presented as mean ± standard deviation values.

