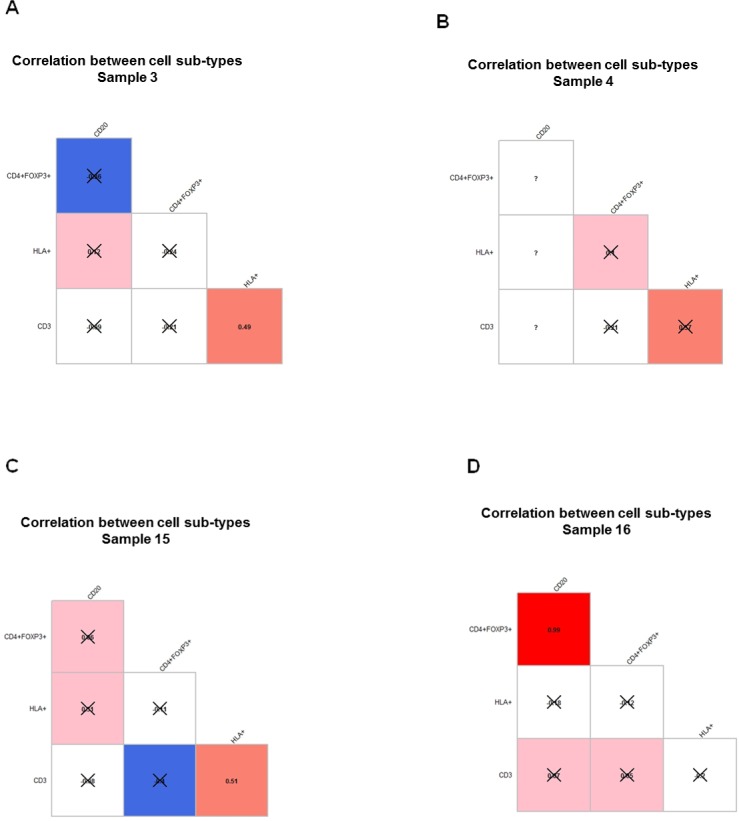
Fig 2. Correlograms demonstrating correlations between ratios of cell counts shown within each FOV from all four patients samples.

A-D. Same samples as in Fig 1 were used. Pearson r coefficient between ratios of cell counts was computed across all FOVs within each tumor sample in each sample. The value of correlation coefficient is shown in each box and represented by the color in increasing order: blue, white, pink, red. Blue represents negative correlation coefficient and inverse correlation. P-value was calculated for each correlation coefficient and crossed boxes show correlation which did not pass the 0.05 cutoff of p-value. Question marks correspond to cases with insufficient data. Correlations that are not statistically significant are X-ed out.
