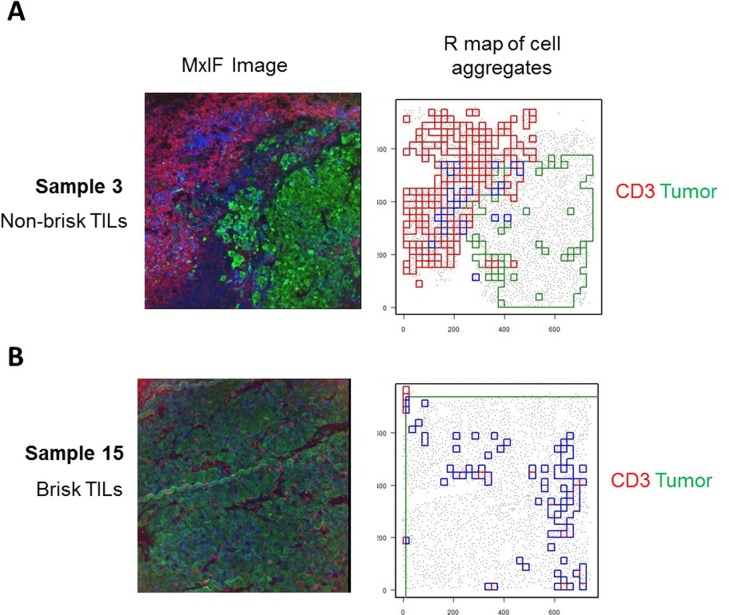
Fig 3. Cell aggregation algorithm (CAA) delineates areas of cell aggregates as polygons of complex shape.
The MxIF images of two exemplar FOVs (seen in Fig 1B) are shown here. A corresponds to the tumor with non-brisk T cell infiltration, while B corresponds to the tumor with brisk tumor T cell infiltration. MxIF images shown on the left (tumor cells (green), CD3+ cells (red)). R maps (shown on the right) demonstrate aggregates of tumor cells (green), CD3+ cells (red) and intersection of these regions (blue).

