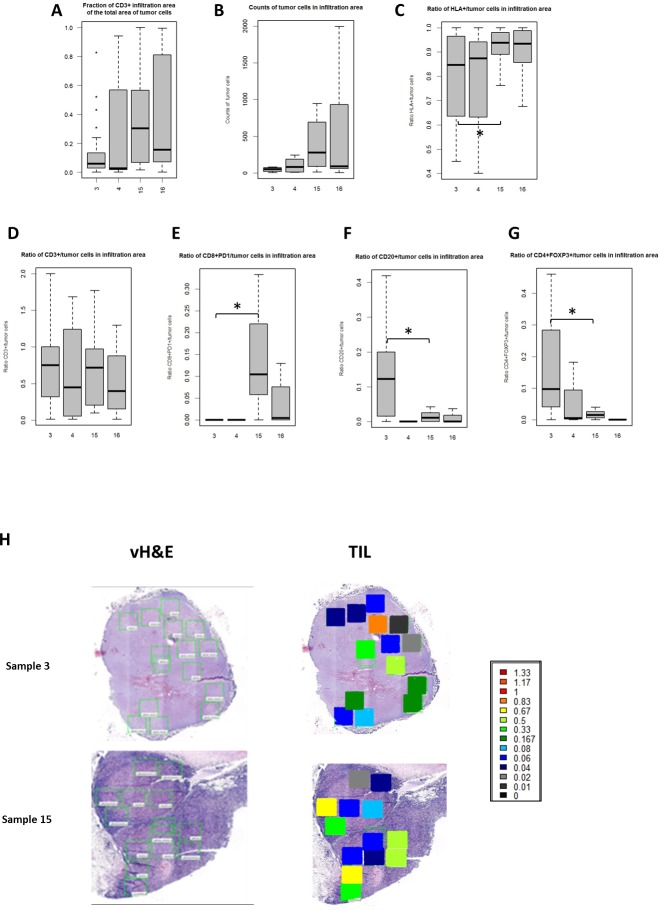
Fig 4. Boxplots showing the range of the ratios of counts of different cell sub-types to the counts of tumor cells or all immune cells per tumor sample in the Infiltration Areas (IAs).
A-G. Box plots represent the range (lower edge– 25 percentile, middle– 50th percentile and top edge– 75th percentile) of ratios across all FOVs for each tumor sample. A. ratio of the area of CD3+ IA to the whole area of tumor cells; B. counts of tumor cells in IAs; C. ratio of HLA+/tumor cells in IAs; D. ratio of CD3+/tumor cells in IAs; E. ratio of CD8+PD1+/tumor cells in IAs; F. ratio of CD20+/tumor cells in IAs; G. ratio of CD4+FOXP3+/tumor cells in IAs. Horizontal line with asterisk shows statistically significant difference. H. Heat map of the two exemplar tumor samples showing the level of CD3+ T cell infiltration in the tumor in the IAs in each individual FOV from 2 patient samples. The color scales indicate the ratios of T cell counts per tumor cells.

