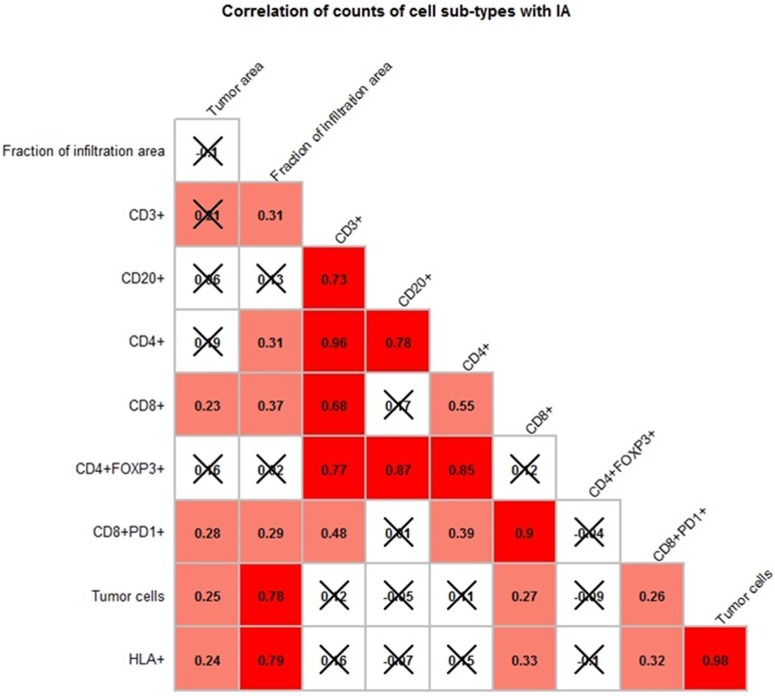
Fig 5. Correlogram demonstrating correlation between ratios of cell counts within each FOV within the Infiltration Areas (IAs).
Pearson r coefficient between the number of cell counts in IAs were computed across all FOVs from 4 tumor samples. The value of correlation coefficient is shown in each box and represented by the color in increasing order: blue, white, pink, red. Question marks correspond to cases with insufficient data. Correlations that are not statistically significant are X-ed out.

