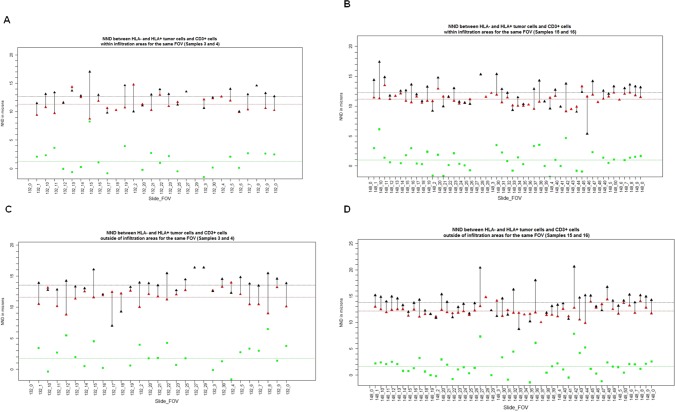
Fig 7. Distance between tumor and T cells.
Distances between CD3+ cells and HLA+ tumor cells (red triangles) and HLA- tumor cells (black triangles) in the neighborhoods of CD3+ cells within IAs (A and B) and outside of IAs (C and D). A and C represents tumor samples with non-brisk TILs, and B and D represent tumor samples with brisk TILS. Each pair of red and black triangles connected by a line represent average distances for a single FOV shown on X–axis. Green squares represent the value of the difference between the two distances. Dotted lines represent average values of corresponding values (red, black and green) across all FOVs.

