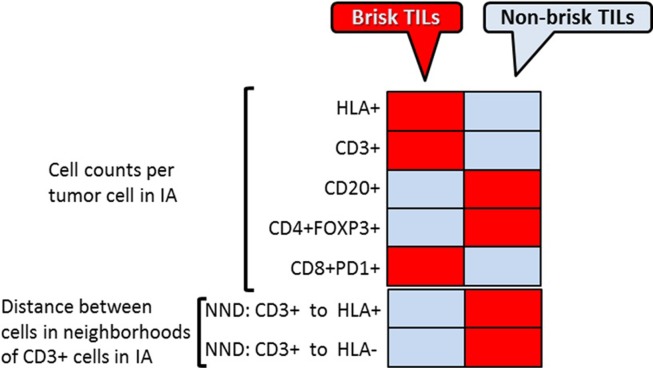
Fig 9. Spatial analysis of tumor-immune cells in melanoma TME.
Heat map summarizes the results of the three type of spatial analysis- direct cell counts, cell aggregates analysis and cell neighborhood analysis between brisk vs. non-brisk TILs TME. Red boxes represent increased numbers and gray boxes–decreased numbers; pink boxes represent no change of the cell counts.

