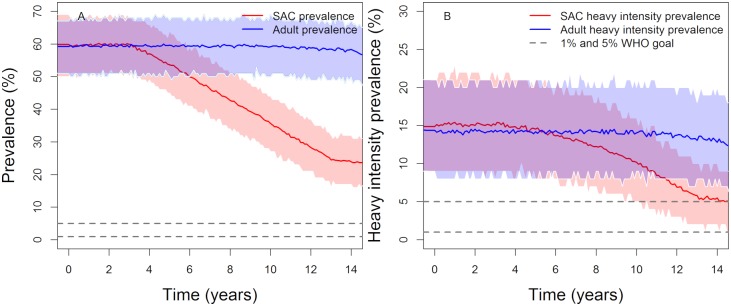
Fig 4. Model projections of annual vaccination of 85% of 1 year olds in high baseline transmission settings.
Graph (A) shows the prevalence of infection, Graph (B) shows the prevalence of heavy-intensity infections, both in school-aged children (SAC) and adults. The average duration of vaccine protection is set at 20 years. Shaded areas (both blue and red) represent the 90% credible interval (90% of the simulated results fall within these shaded areas).

