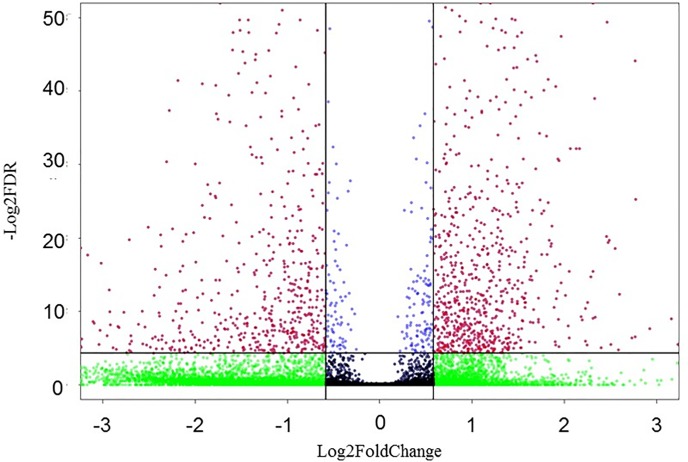
Fig 1. Volcano plot of differentially expressed genes of infected cells (APEC-O78 infection) and non-infected cells (Control).
Red dots represent up-regulated genes, green, blue and black dots represent non-differentially expressed genes (Fold Change>1.5 or Fold Change<0.667, FDR<0.05). The horizontal axis represents the fold change between infected and control cells. The vertical axis represents the FDR‐value of the multiple‐test for the differences between samples.

