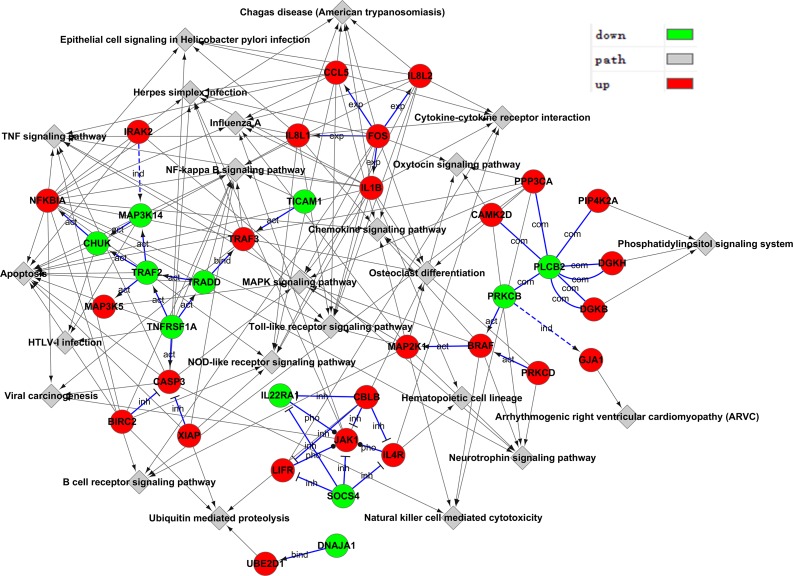
Fig 5. Gene-Act network of differential genes according to pathways in the database.
Red dots represent up-regulated genes and green dots represent down-regulated genes. The arrows indicate the connection and regulatory relationship between two genes. Genes that have more connections with other genes have a higher degree score.

