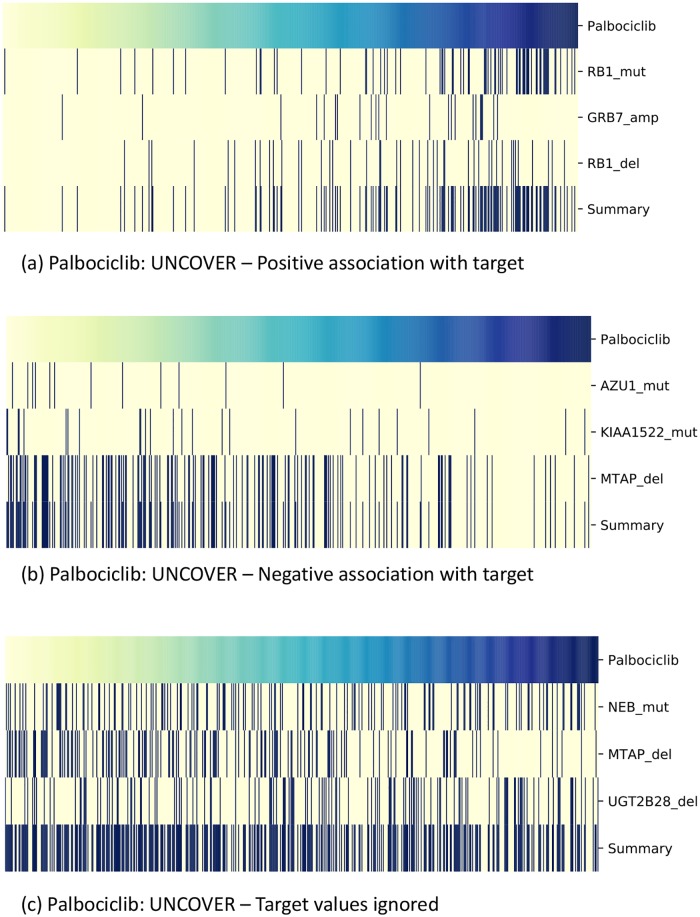
Fig 3. Impact of the target on the results.
UNCOVER results for target Palbociclib considering or ignoring target values. (a) Solution found by UNCOVER looking for an association with samples with high target values. (b) Solution found by UNCOVER looking for association with low target values. (c) Solution found by UNCOVER when the target values are ignored. Each panel shows the value of the target (top row) for various samples (columns), with yellow being negative and blue being positive values. For each gene in the solution, alterations in each sample are shown in dark blue, while samples not altered are in yellow. The last row shows the alteration profile of the entire solution.

