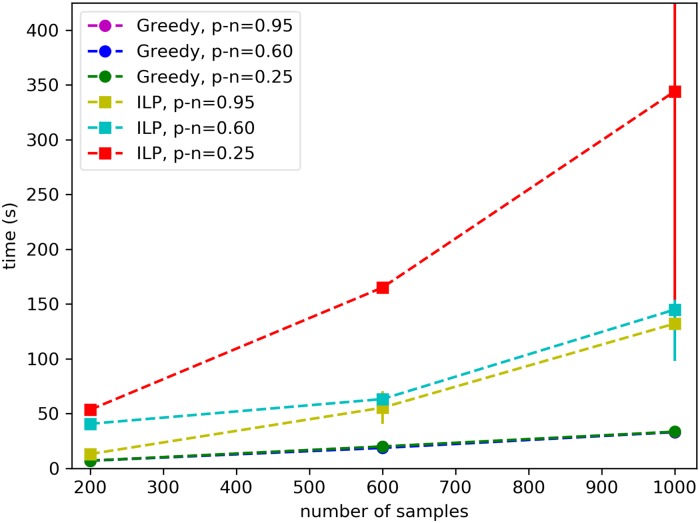
Fig 5. Running time of UNCOVER on simulated data.
The running time (expectation and standard deviation) of the greedy algorithm and of the ILP approach are shown for different number of samples and the difference p − n between the fraction p of samples with positive target and the fraction n of samples with negative target covered by the the correct solution.

