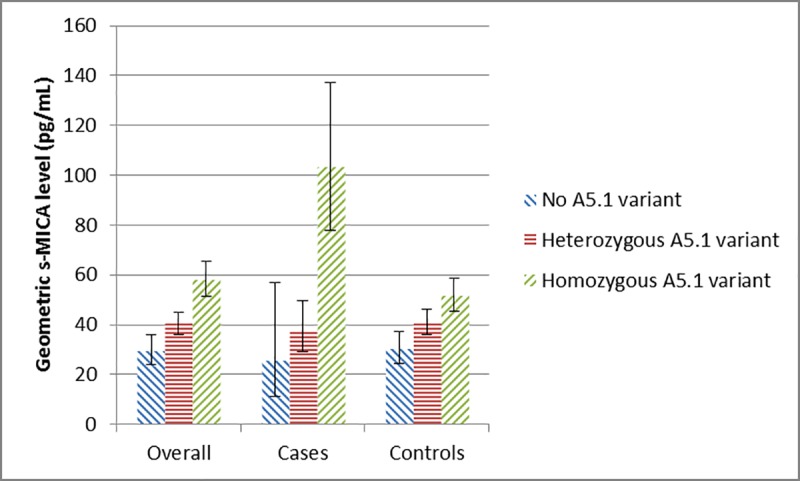
Fig 2. Distribution of s-MICA levels by MICA A5.1 polymorphism genotype.

Unadjusted geometric means for s-MICA levels are presented for each group of participants having 0, 1 or 2 A5.1 allele copies for the polymorphism, respectively (additive model). The error bars represent the lower and upper 95% CI for the unadjusted s-MICA geometric mean values.
