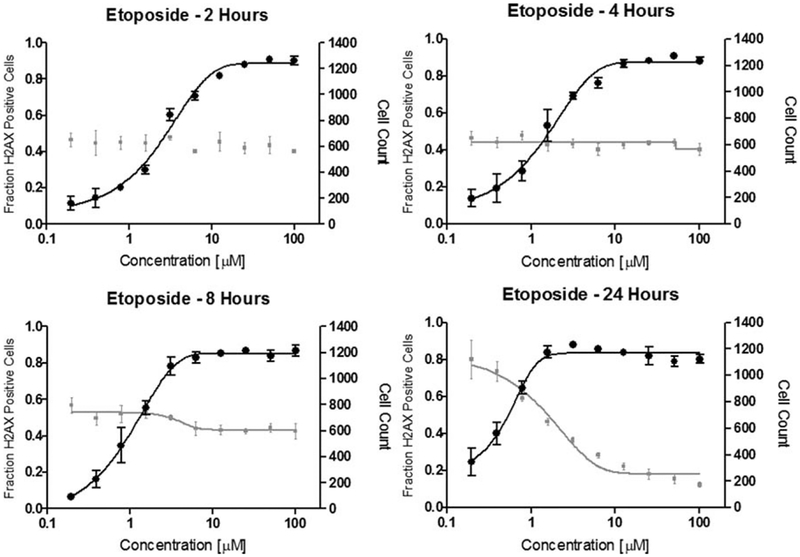
Fig. 2.
Dose response curve for DNA DSB caused by etoposide. Shown here is the fraction of nuclei showing γH2AX immunofluorescence—gated as 200 RFU and higher—divided by the total number of cells. Interestingly, the total number of cells does not change drastically although almost all cells turn γH2AX positive at high etoposide concentrations.

