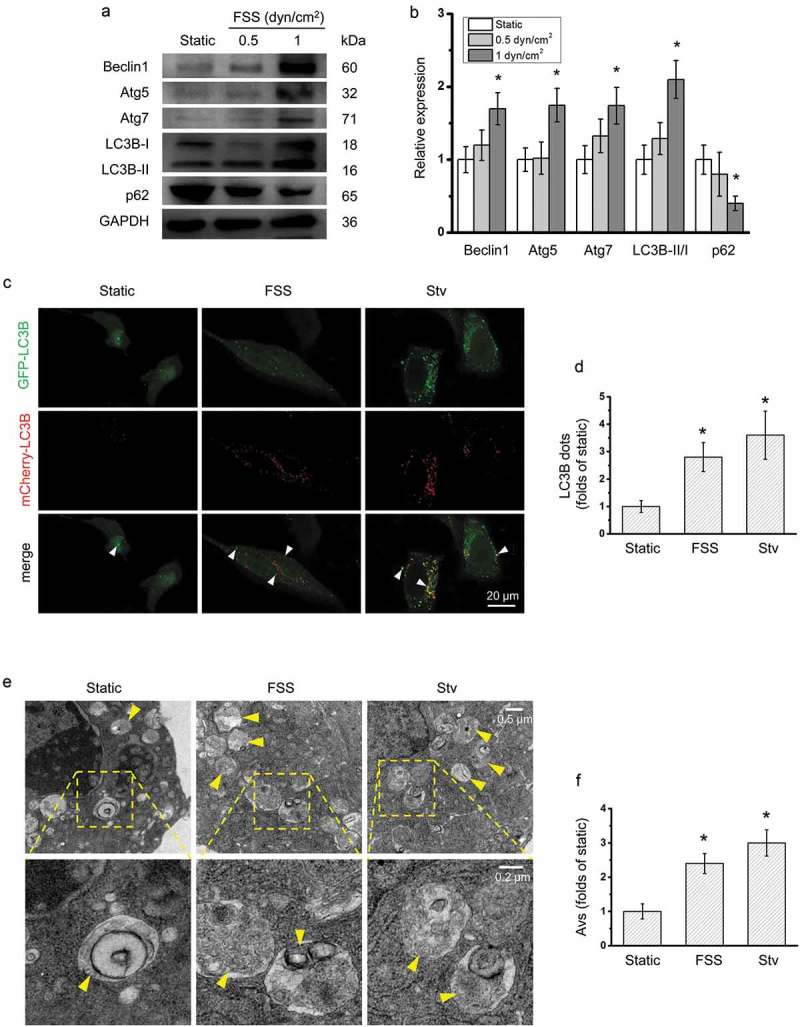
Figure 1.

FSS activated autophagy in HepG2 cells. (a) HepG2 cells were exposed to FSS at 0.5 or 1 dyn/cm2 for 0.5 h, or treated with Earle’s balanced salt solution (EBSS) for 2 h. Lysates were probed with antibodies as indicated. (b) Quantification of protein expressions in (a). (c) After Ad-mCherry-GFP-LC3B transfection, HepG2 cells were loaded with FSS at 1 dyn/cm2 for 0.5 h or treated with EBSS for 2 h. Immunostaining of LC3B (Green, GFP-LC3B; Red, mCherry-LC3B) were performed. The white arrow indicated the LC3B punctate dots (yellow dots, autophagosomes). (d) LC3B dots were counted from at least 20 random cells (n = 3). (e) HepG2 cells were loaded with FSS at 1 dyn/cm2 for 0.5 h or treated with EBSS for 2 h. Representative images were photographed by TEM. The yellow arrow indicated the autophagic vacuole (AV). (f) AVs were counted from at least 10 random field (25 μm2) imaged by TEM (n = 3).
*p < 0.05 vs. static.
