Figure 6.

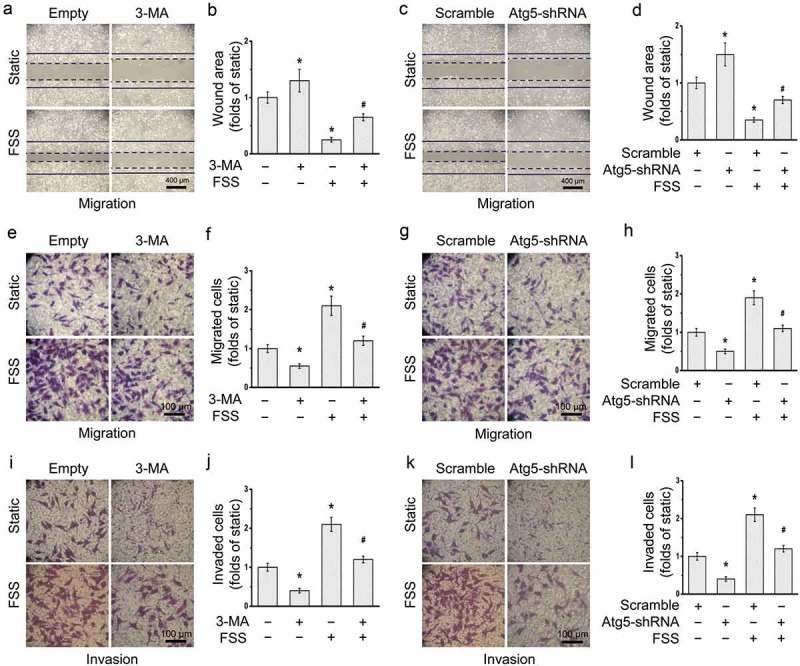
Autophagy inhibition attenuated FSS-induced migration and invasion in HepG2 cells. HepG2 cells were loaded with FSS at 1 dyn/cm2 with or without treatment of 5 mM 3-MA for 12 h (a-b, e-f, and i-j), or with or without transfection of lentivirus-delivered scramble or Atg5 shRNAs for 12 h (c-d, g-h, and k-l). (a, c) Representative images of wound area were photographed. The solid line represents the initial wound, and the dashed line represents the final wound after treatment. The FSS direction was perpendicular to the solid lines (the scratch wound). (B, D) Quantification of wound areas in (a,c) at least 10 random field (1.6*104 μm2) (n = 3). (e, g) Representative images of cell migration of FSS-applied cells were photographed by Transwell migration assay. (f, h) Quantification of migrated cells in (e,g). (i, k) Representative images of cell invasion of FSS-applied cells were photographed by Transwell invasion assay. (j, l) Quantification of invaded cells in (i,k).
*p < 0.05 vs. Static; #p < 0.05 vs. FSS.
