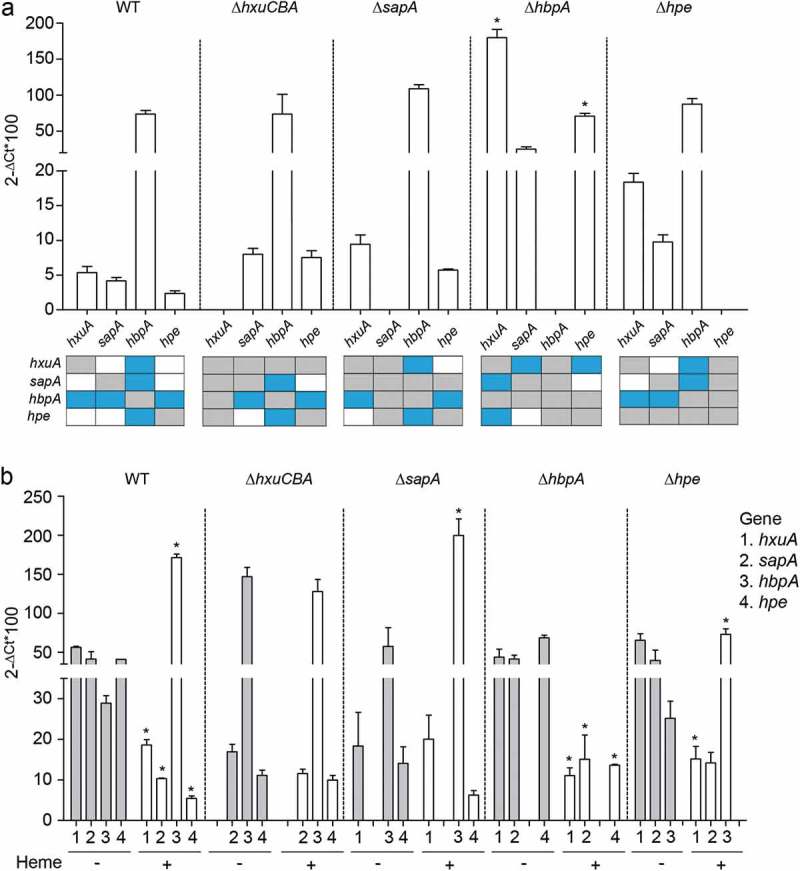
Figure 3.

Expression of NTHi heme acquisition systems. (a) Expression of the hxuA, sapA, hbpA and hpe genes in NTHi375 WT, ΔhxuCBA, ΔsapA, ΔhbpA, and Δhpe strains grown in sBHI. Expression of the hbpA gene was higher than that of hxuA, sapA, and hpe (WT strain, higher expression of hbpA than that of hxuA (p < 0.05), sapA and hpe (p < 0.01); NTHi375ΔhxuCBA, higher expression of hbpA than that of sapA and hpe (p < 0.0005); NTHi375ΔsapA, higher expression of hbpA than that of hxuA and hpe (p < 0.0005); NTHi375Δhpe, higher expression of hbpA than that of hxuA (p < 0.05) and sapA (p < 0.0005)). Expression of the hxuA and hpe genes was higher in NTHi375ΔhbpA than in the WT strain (p < 0.0001 and p < 0.01, respectively). Bottom panel: schematic representation of each gene expression compared to each other, in the WT and mutant strains. Color code: blue, statistically significant differences; gray, not determined; white, no significant differences. Data are shown as mean ± SEM. Statistical comparisons of the means were performed with two-way ANOVA (Tukey´s multiple comparisons test). (b) Gene expression and heme sensing. In NTHi375 WT, ΔhbpA and Δhpe strains, hxuA, sapA, and hpe gene expression was higher in heme-restricted medium than in sBHI (WT: hxuA (p < 0.001), sapA (p < 0.01), hpe (p < 0.001); NTHi375ΔhbpA: hxuA (p < 0.01), sapA (p < 0.05), hpe (p < 0.0001); NTHi375Δhpe, hxuA, p < 0.05). In NTHi375 WT, ΔsapA and Δhpe strains, expression of hbpA was lower upon heme depletion (WT, p < 0.0001; NTHi375ΔsapA, (p < 0.001); NTHi375Δhpe, p < 0.05). Data are shown as mean ± SEM. Statistical comparisons of the means were performed with two-way ANOVA (Sidak´s multiple comparisons test).
