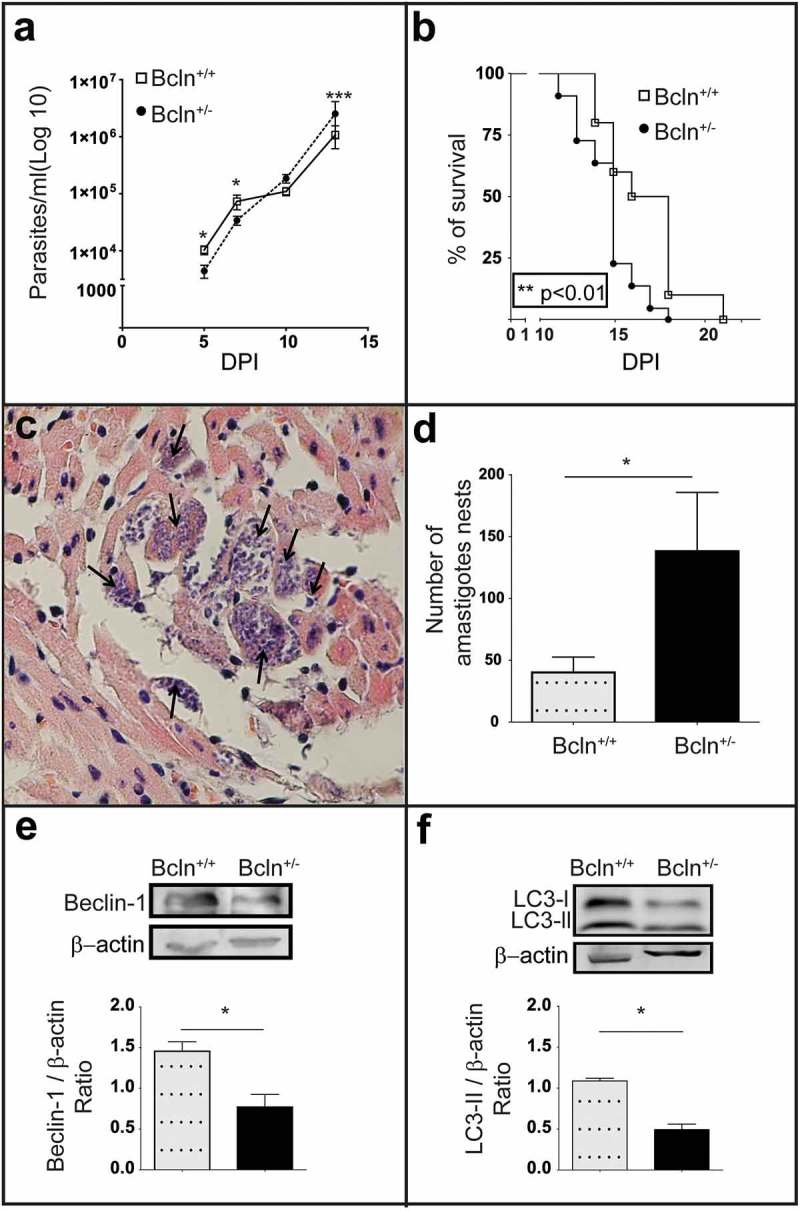
Figure 1.

The deficiency of autophagy exacerbates T. cruzi infection in mice: (a): Parasitemia curve obtained from C57BL/6J wild type mice (Bcln+/+) and Beclin-1 heterozygous knock-out mice (Bcln±) infected with T. cruzi trypomastigotes of Y-GFP strain as described in materials and methods (Mann-Whitney test, * p < 0.05, *** p˂0.001). (b): Percentage of survival of Bcln+/+ and Bcln± infected with T. cruzi Y-GFP. Data were obtained from three independent experiments of at least 4 mice each (log rank Mantel-Cox test, ** p˂0.01). (c): Cardiac histopathology by H&E staining. Arrows indicate nests of amastigotes. (d): Number of amastigotes nests in cardiac semi-serial sections. Data were obtained from two independent experiments of at least 4 mice each (Mann-Whitney test, * p < 0.05). (e): Representative image showing the expression of Beclin-1 in the liver of non-infected Bcln+/+ and Bcln± mice by western blot. Graphic shows the OD of Beclin-1 band relative to β-Actin expression. Bars indicate the mean ± the standard error of two independent experiments with at least 2 mice each (Student´s t-test, * p < 0.05). F: Representative image showing the expression of LC3 forms in the liver of non-infected Bcln+/+ and Bcln± mice by western blot. Graphic shows the OD of LC3-II relative to β-actin expression. Bars indicate the mean ± the standard error of two independent experiments of at least 2 mice each (Student´s t-test, * p < 0.05).
