Figure 3.

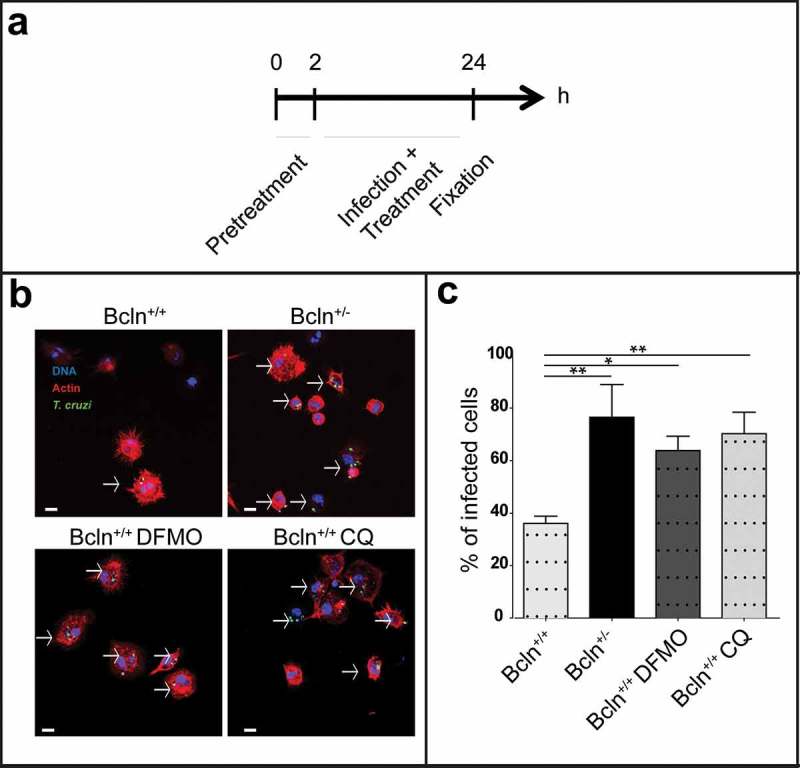
Inhibition of autophagy increases T. cruzi infection in peritoneal cells. Peritoneal cells were isolated by lavage of the peritoneal cavity of Bcln+/+ or Bcln± mice and then infected with T. cruzi (MOI = 10) for 24 h before fixation. Samples, were then stained with TRITC-phalloidin and Hoechst and processed by confocal microscopy (see details in materials and methods). Other samples from Bcln+/+ mice were treated with 20 μM CQ or 10 mM DFMO from 2 h before and during infection and then processed as above. (a): Scheme of the infection protocol. (b): Representative images depicting the level of cellular infection under the indicated conditions. Parasites were visualized in green, actin cytoskeleton in red and the nuclei in blue. Bars: 5 µm. (c): Percentage of infected cells in the indicated conditions. Bars indicate the mean ± the standard error of at least three independent experiments. Number of counted cells: 100 to 300 cells each experiment (Dunnet test, * p < 0.05; ** p < 0.01).
