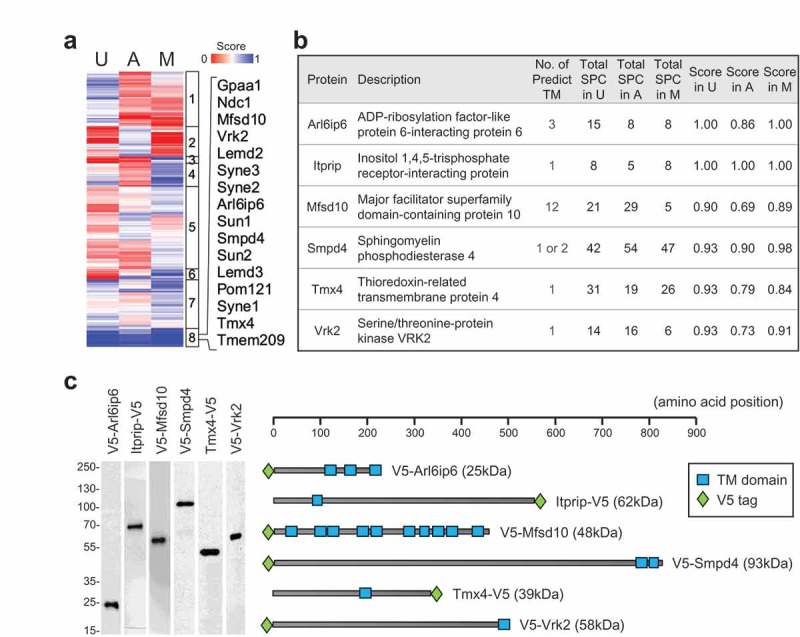
Figure 3.

Cluster analysis, selection of target set and characterization of target- transduced cell populations. (a) Depiction of cluster analysis of annotated TM proteins in the three cell types. NE enrichment scores are color coded as indicated. Right panel: List of proteins in cluster 8. (b) Proteins selected for analysis, together with a description of each protein, the number of predicted TM domains, spectral counts and NE enrichment score obtained in each cell type. (c) Left: Western blot analysis of C3H cell populations stably expressing the candidates as detected by anti-V5 antibodies. Migration of molecular weight markers is indicated on left. Right: Schematic representation of the size of the proteins, the position of the epitope tag, and predicted transmembrane segment(s) using CCTOP program.
