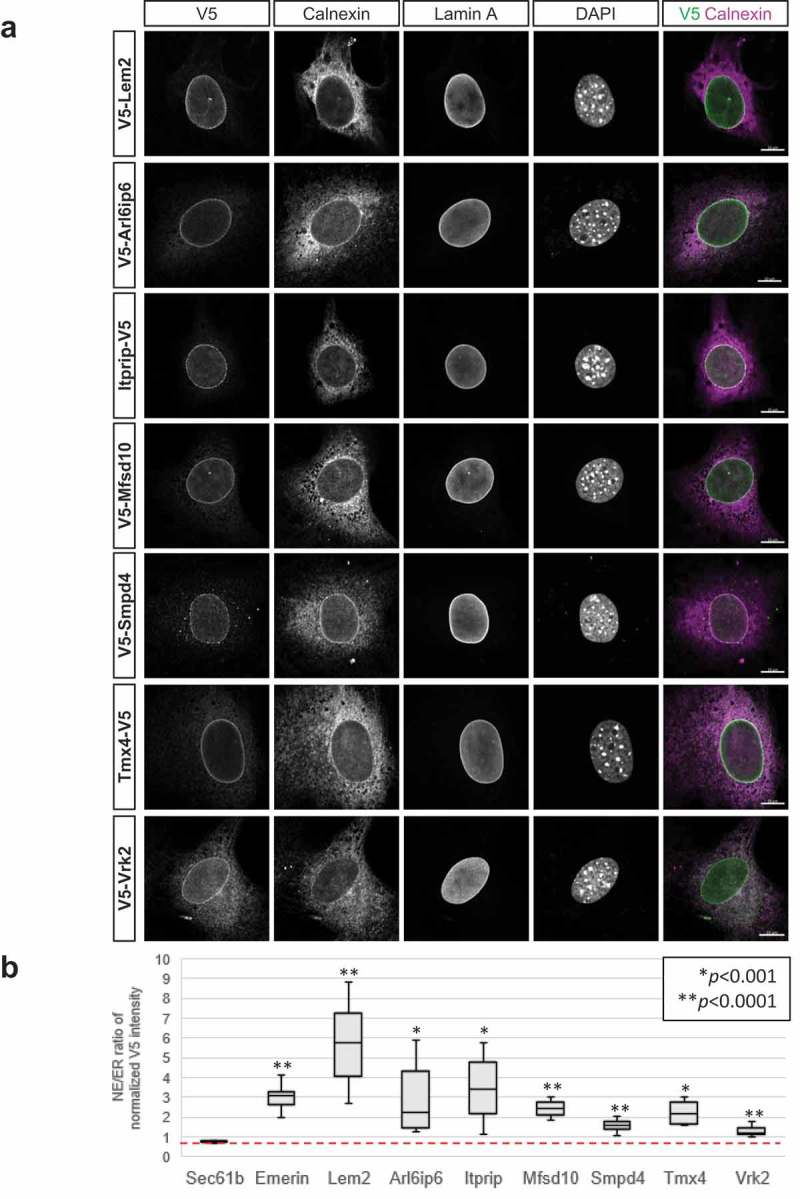
Figure 4.

Immunofluorescence localization of ectopically expressed target proteins. (a) Micrographs of representative cells from ectopically expressing populations that were co-labeled with antibodies to the V5 epitope tag (to detect indicated targets), calnexin and lamin A. DNA staining (DAPI) and a merge of V5 and calnexin labeling is shown in the right panels. Lem2 and Vrk2 are included as positive controls. Scale bars, 10μm. (b) Graph showing relative enrichment of targets in the NE, determined by ratio of V5/calnexin staining in the NE vs the V5/calnexin ratio in the immediately adjacent peripheral ER. Quantification is described in Materials and Methods. Red line indicates the V5/calnexin ratio in the NE vs peripheral ER for ectopically expressed Sec61β. Stably transduced populations were examined in all cases except for Smpd4, which was visualized in transiently transduced cells (see Materials and Methods).
