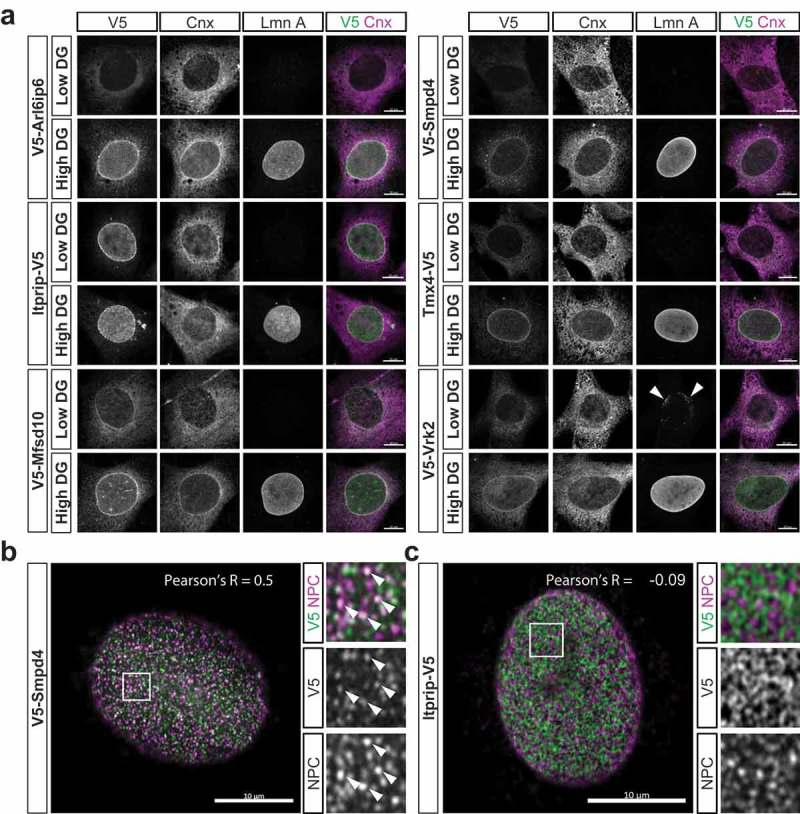
Figure 5.

Immunofluorescence analysis of the localization of target proteins with respect to NE substructure. (a) Representative images obtained with antibody staining after cell permeabilization with low or high concentrations of digitonin (DG). C3H cells ectopically expressing the depicted targets were incubated with antibodies to the V5 tag, calnexin and lamin A. Merged images of V5 and calnexin staining are shown on the right. (b, c) High resolution immunofluorescence images, obtained with Airyscan, of cells expressing ectopic Smpd4 or Itprip as indicated. Cells were co-labeled with antibodies to V5 and RL1, a monoclonal antibody recognizing FG repeat Nups of the NPC [63], after fixation and permeabilization with standard conditions. Pearson’s correlation coefficient R (indicated) shows substantial co-localization between V5-Smpd4 and the NPC but no significant co-localization between Itprip-V5 and the NPC. Right panels show higher magnification views of areas indicated by boxes. In cells expressing V5-Smpd4, examples of foci co-labeled with RL1 and anti-V5 are indicated (arrowheads). All panels: scale bars, 10μm.
