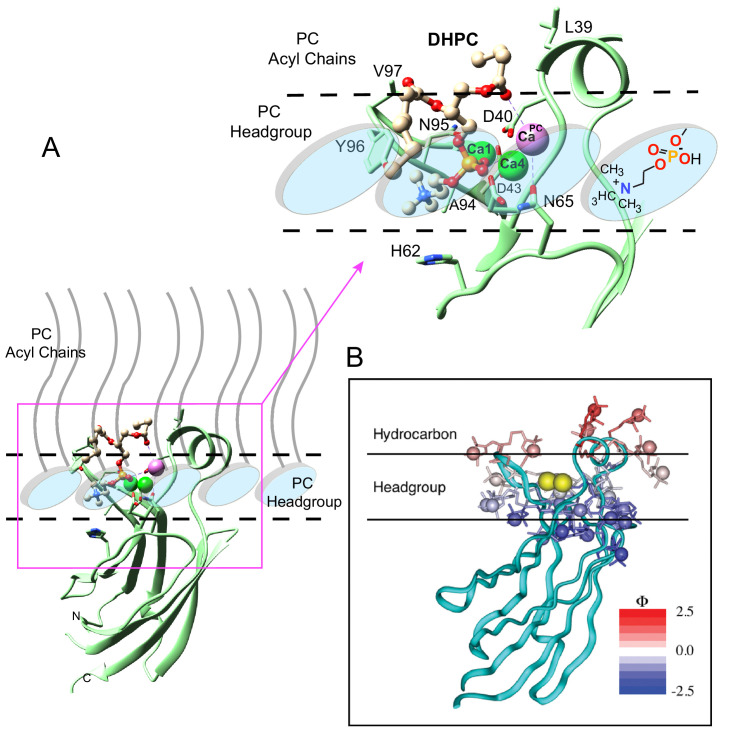
Figure 5. Model of the cPLA2α C2-domain selectively interacting with the PC membrane interface.
(A) Interaction of the C2-domain–DHPC structural complex with a PC membrane interface produced by ad hoc modeling. The dashed horizontal lines represent planar boundaries for the lipid headgroup and hydrocarbon regions of the PC bilayer. The crystal structure of the C2-domain–DHPC complex is represented as pale green ribbon. The Ca2+ ion that is unique to the C2-domain–DHPC complex is shown as a pale magenta sphere; whereas the other two Ca2+ ions are shown as green spheres. In the bound DHPC structure, blue, red, orange, and beige colors represent nitrogen, oxygen, phosphorus, and carbon atoms, respectively. The zoomed view shows how the orientation and position of the PC headgroup bound by the C2-domain requires no major conformational change relative to those of unbound PC headgroups comprising the membrane interface. Membrane docking orientation and penetration depth by the C2-domain are based on previous data illustrated in panel (B) (Nalefski and Falke, 1998; Ball et al., 1999; Malmberg et al., 2003; Malmberg and Falke, 2005). (B) cPLA2α C2-domain docking orientation and penetration depth at the membrane interface, as determined by electron paramagnetic resonance power saturation. [Reprinted (adapted) with permission Malmberg et al., 2003, Biochemistry 42, 13227–13240. Copyright: American Chemical Society.]. The crystal structure of the lipid-free C2-domain (PDB: RLW) is represented by the cyan ribbon with two Ca2+ ions shown as yellow spheres. The horizontal lines represent planar boundaries for the lipid headgroup and hydrocarbon regions of the bilayer. Protein spin labels oriented in their final optimized conformations are colored according to their measured depth parameters (Φ), with positive and negative depth parameters indicated by increasing red and blue color intensity, respectively.

