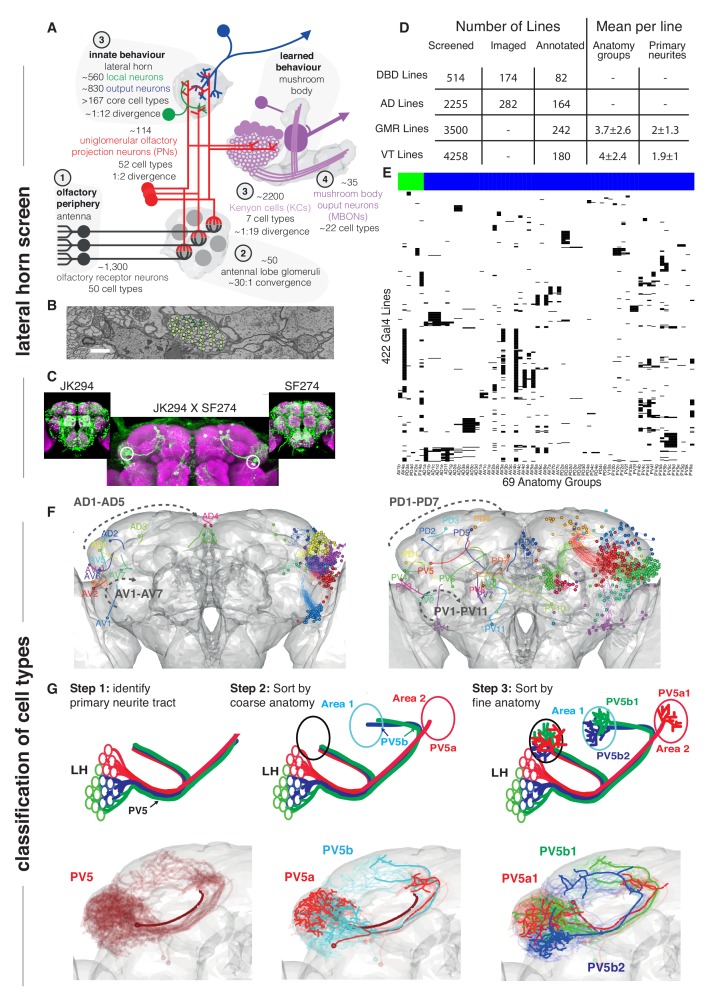
Figure 1. Screen for genetic driver lines labeling Lateral Horn Neurons.
(A) Flow diagram following olfactory information to third order neurons of the LH and MB calyx. (B) Section through the PV5 primary neurite tract within the EM data; each profile was identified as an LHN (circles) or non LHN (triangles) by tracing to the first branch point. Scale bar 1 μm. (C) Sample Split-GAL4 intersection with parental lines inset. Cell body locations marked with white circle. (D) Summary table for the genetic screen. (E) Matrix summarizing which driver lines contained which anatomy groups (colored LHON = blue, LHLN = green). The vast majority of genetic driver lines labeled only a few LH anatomy groups. NB these data are also available as a supplementary spreadsheet. (F) Anterior (left) and posterior (right) views of the different LHN primary neurite tracts demonstrating the broad origin of LHNs. Grey dashed arrow indicates the order of increasing tract numbers for ventral PNTs (Lower arrow) and dorsal PNTs (above). The entry point into the brain rather than soma location was the point of reference for naming tracts. (G) Upper panels, cartoons summarizing the logic of the LHN naming system, lower panels, the PV5 primary neurite as an example. Note this includes only 3 out of 24 cell types in PV5. For each cell type one cell is highlighted (thick lines).


