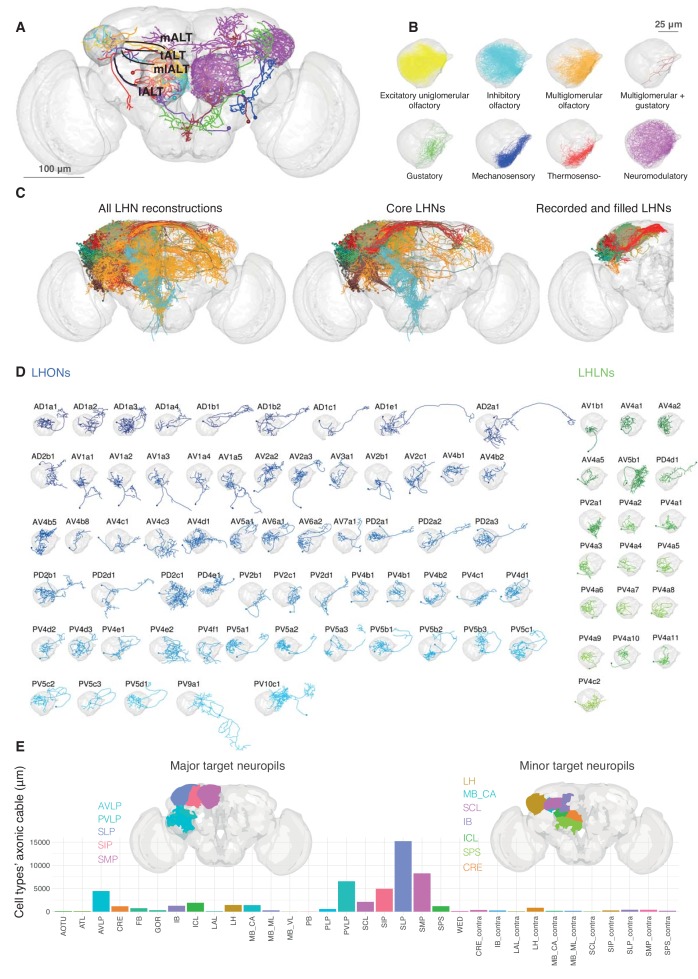
Figure 2. Single cell anatomy of the Lateral Horn.
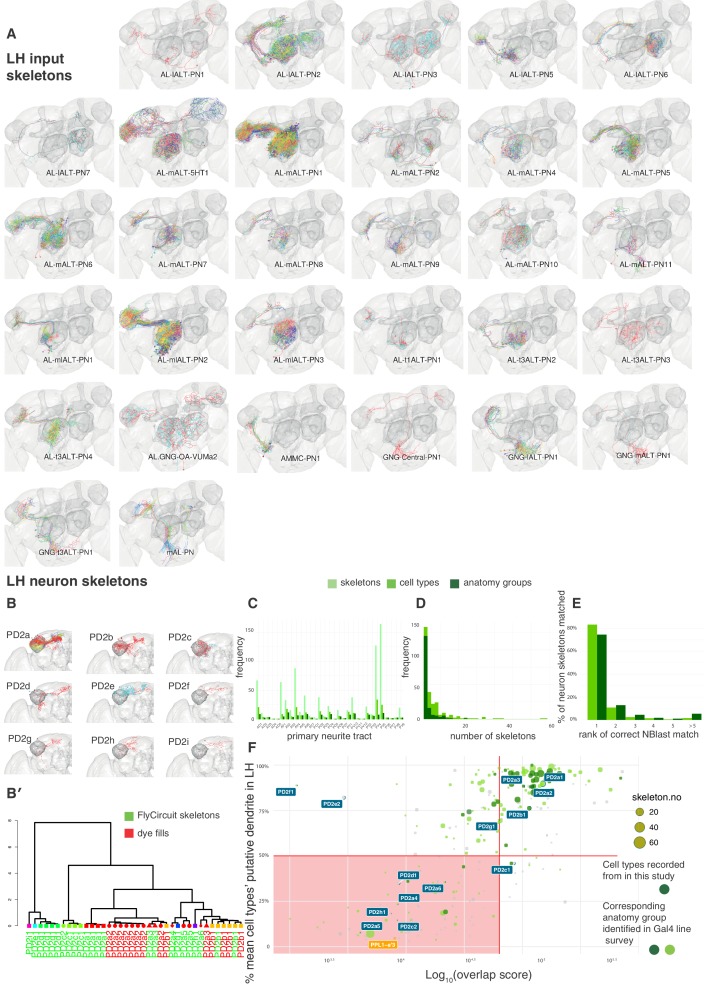
(A) Sample single projection neurons with axonal projections in the LH, showing all major axon tracts and sensory modalities that provide input. (B) Close up of the LH with axonal arbors for all FlyCircuit neurons of each presumptive sensory modality. (C) Overview of our annotated LHN skeleton library showing all skeletons with LH arbors, core LHN cell types (see Figure 2—figure supplement 1) and those neurons reconstructed after electrophysiological recording in the present study. Neurons colored by anatomy group. (D) Visualization of single exemplars for all cell types for which we have >=3 skeletons in the library, or from which we made electrophysiological recordings in this study. Output neurons in blue, local neurons in green. (E) Bar chart showing, for each target neuropil, the total axonal cable length contributed by all core LHONs (calculated as sum of mean for each identified cell type). Brains plots show in major (> 3 mm axonal cable) and minor (1–3 mm) targets of LHONs. Brain neuropil according to Ito et al. (2014); mALT, medial antennal lobe tract, tALT, transverse antennal lobe tract, mlALT, medio-lateral antennal lobe tract, lALT, lateral antennal lobe tract.


