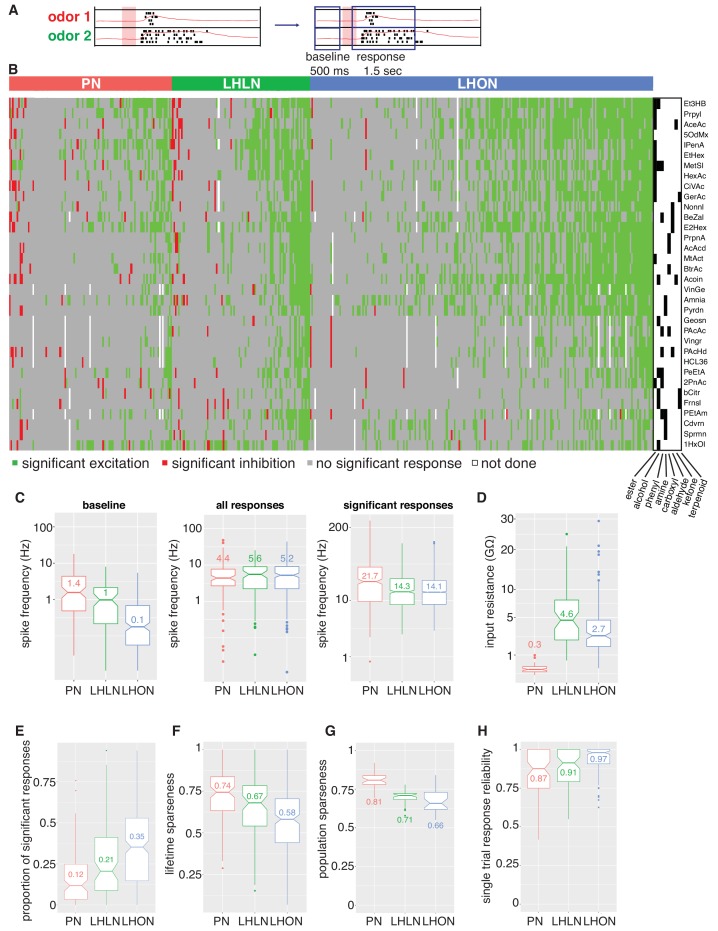
Figure 4. Population summaries of second and third order olfactory neurons.
(A) Diagram of time windows used when identifying significant spiking responses (see Materials and methods). (B) Matrix showing significant spiking responses of PNs, LHLNs, and LHONs (colors match Figure 3) to different odors. A black and white matrix shows the chemical groups of the different odors (see supplementary spreadsheet). (C) Comparing firing rates of PNs, LHLNs, and LHONs. Baseline firing rate (baseline), firing rate in the response window (all responses), and firing rate in the response window for significant responses only (significant responses). LHONs have a lower baseline firing rate and, when using significant response only, a lower odor-evoked firing rate then PNs. (D) Input resistance of PNs, LHLNs, and LHONs. (E) Different measures of sparseness of odor responses in PNs, LHLNs, and LHONs showing that LHONs are broader then PNs. (F) Single trial response reliability using a threshold of 5 Hz for PNs, LHLNs, and LHONs. Responses were reliable for all three groups with LHON responses slightly more reliable probably due to differences in baseline firing rate.

