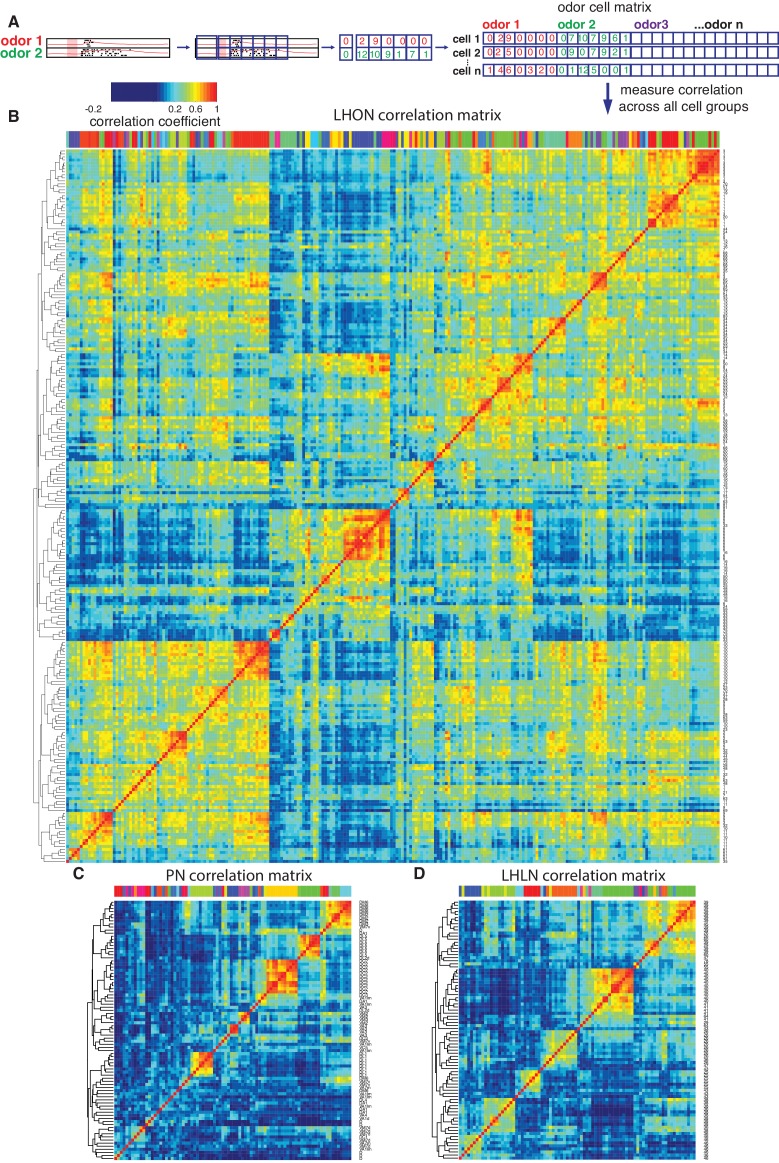
Figure 6. Cross-correlation clustering of odor response data for PNs, LHLNs, and LHONs.
(A) Analysis pipeline for generating the cell-odor response correlation matrix and measuring correlation across cells. Responses were binned (blue squares, 50 ms) and the mean firing rate was calculated for each time bin. For each cell, the responses to all odor, ware concatenated into a single vector and a matrix of all the cell odor responses was generated. This cell-odor matrix was used to calculate the Pearson’s correlation between the odor responses for all pairs of cells. (B–D) Heatmaps of the resultant cross-correlation matrices for LHONs, PNs and LHLNs, respectively. To allow comparison all three heatmaps share the same color scale for the correlation coefficient (top left) demonstrating a higher correlation between LHONs as well as considerable higher level of off-diagonal correlation structure.

