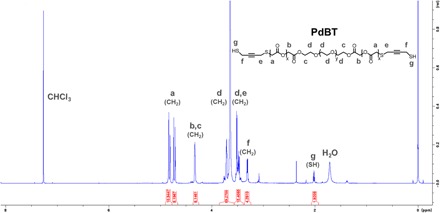
Fig. 3. Confirmation of PdBT structure using1H NMR.

Peaks are identified using the letters a to g. Peak integrals are shown below peaks and are calibrated according to the known molecular mass of the central PEG block (left peak d).

Peaks are identified using the letters a to g. Peak integrals are shown below peaks and are calibrated according to the known molecular mass of the central PEG block (left peak d).