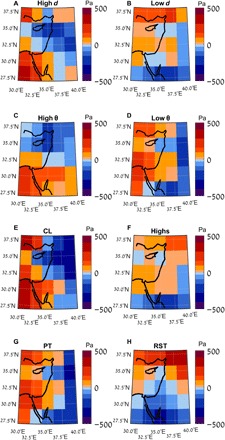
Fig. 3. SLP mean composites for eastern Mediterranean synoptic systems.

SLP composites for the top and bottom five percentiles of the d and θ distributions (A to D) and the CL, High, PT, and RST synoptic systems (E to H). The values are provided as deviations in Pa from the mean SLP value of each composite. The corresponding absolute SLP patterns for the synoptic systems are shown in fig. S3.
