
Fig. 5. Two drug treatments side by side with untreated cells.
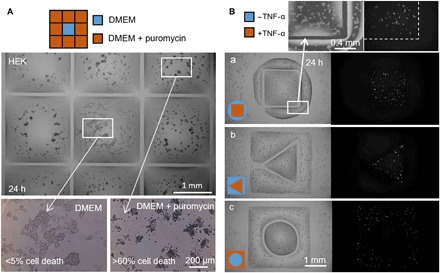
Fluid walls were built around HEK cells (300,000 cells; 6-cm dish) grown for 24 hours. (A) Puromycin (3 × 3 grid; 2 mm × 2 mm chambers). The printer adds 1 μl of medium to the central chamber and 1 μl of medium + puromycin to peripheral ones (final concentration, 10 μg/ml), as indicated in the cartoon. Cell viability is assessed after incubation (37°; 24 hours) using a trypan blue exclusion assay. Cells in outer chambers are dead (more than 60% in each one), whereas those in the central one remain alive (less than 5% cell death). This assay has been replicated three times. (B) TNF-α. Pairs of chambers with distinct shapes are printed, one surrounding the other. The printer adds 0.5 μl of medium ± TNF-α (final concentration, 10 ng/ml) to one or other volume (as in cartoons). As cells encode a GFP-reporter gene controlled by a promoter switched on by TNF-α, they fluoresce green on exposure to the cytokine. Fluorescence images show that only cells in the treated volume fluoresce green. Volume pairs had the following dimensions: (a) square (side, 1.8 mm) in circle (radius, 1.75 mm); (b) triangle (side, 1 mm) in square (side, 3.5 mm); (c) circle (radius, 1 mm) in square (side, 3.5 mm).