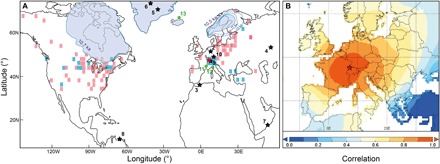
Fig. 1. Location and spatial correlation maps.

(A) Records discussed in the main text (stars) and the Supplementary Materials (dots) are shown together with the Laurentide and Fennoscandian ice sheet (LIS and FIS, respectively) extents at ~10.5 ka BP (30, 35). Pollen-gridded temperature differences (0.5 ka BP minus 10.5 ka BP; red is warming and blue is cooling) is also given (4). (1) Milandre Cave (red star; this study), (2) Bunker Cave, (3) Mediterranean site MD95-2043, (4) Kinderlinskaya Cave, (5) Greenland Ice Sheet Project 2 (GISP2), (6) North Greenland Ice Core Project (NGRIP), (7) Qunf Cave, (8) Cariaco Basin, (9) Gerzensee Lake, (10) Ammersee Lake, (11) Chauvet Cave, (12) Gemini Lake, and (13) Atlantic site MD99-2275 records. (B) Modern spatial correlation between Basel instrumental temperatures for the interval 1901–2014 and the CRU TS4.01 temperature dataset for Europe (see fig. S3). The red color indicates a high correlation between the temperature variations at the study site and the rest of Europe.
