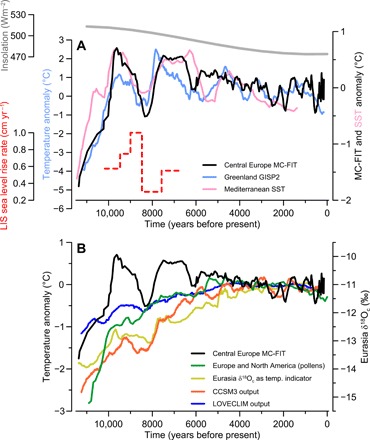
Fig. 4. Holocene temperature records and forcing.

Similar temperature reconstructions between the Greenland, Mediterranean Sea, and central Europe areas (A) that show a different early to middle Holocene trend compared to high-latitude proxies and model simulations (B). (A) Switzerland MC-FIT (black; this study), Mediterranean SST (23) (pink) (both smoothed with a seven-value running mean) and Greenland GISP2 temperature (10) (blue; 401 years running mean) are shown together with July insolation at 30°N (51)(gray) and LIS sea level rise rate (33) (red). (B) European pollen record (4) (green) and Eurasia δ18Oc (as winter temperature indicator) (5) (yellow). Also shown are Switzerland MC-FIT (black), regional CCSM3 (3) (orange), and mid-latitude band (30° to 60°N) LOVECLIM (10) (blue) transient simulations of mean annual temperatures. Anomalies are shifted for comparison.
