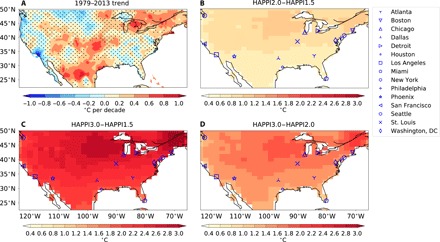
Fig. 1. Observed and projected changes in extreme high temperature over the contiguous United States.

(A) Estimated trends of the annual mean TXx values between 1979 and 2013 from the EWEMBI dataset. (B) Difference in the decadal averages of TXx between the 2° and 1.5°C worlds. (C) Same as (B) but between the 3° and 1.5°C worlds. (D) Same as (C) but between the 3° and 2°C worlds. The differences in (B), (C), and (D) are averages across 30 bias-corrected ensemble members of Hadley Centre Atmospheric Model version 3P (HadAM3P). Stippling indicates regions where neither trends nor differences are significant at the 5% significance level using the two-sigma test and the Kolmogorov-Smirnov test, respectively. The markers indicate the locations of the cities included in this study.
