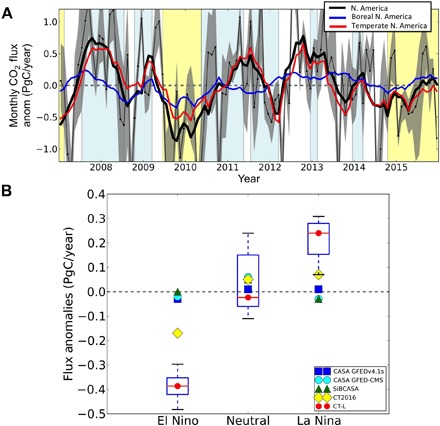
Fig. 2. Anomalies of derived NEE over North America display distinct responses to different phases of ENSO between 2007 and 2015.

(A) Derived monthly NEE anomalies from 18 inversions considered in this study from CT-L (gray shading), their monthly means (black thin line), and 6-month running averages (black thick line). Blue and red solid lines indicate the 6-month running averages of monthly NEE anomalies derived for boreal and temperate North America. Light yellow shading indicates El Niño, whereas light blue indicates La Niña. (B) Average monthly NEE anomalies during El Niño, neutral, and La Niña periods [which were indicated by yellow, white, and blue shadings in (A)], derived from TBMs (CASA GFEDv4.1s, CASA GFED-CMS, and SiBCASA), CarbonTracker (CT2016), and CT-L (this study). Anomalies derived from CT-L were indicated by the boxplot with red lines representing the medians, blue boxes indicating the 25th and 75th percentiles, and black dashed bars indicating the minimums and maximums of the ranges calculated from the 18 inversions.
