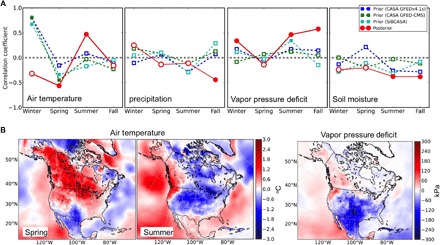
Fig. 3. Climate drivers for anomalies of North American NEE and their response to ENSO.

(A) Correlation coefficients between NEE anomalies and anomalies of air temperature, precipitation, VPD, and SM in different seasons using prior fluxes (computed from TBMs) and fluxes derived from CT-L. Strong correlations with P < 0.1 are indicated by color-filled symbols, whereas weaker correlations with P > 0.1 are shown in empty symbols. (B) Differences of average air temperature anomalies between El Niño and non–El Niño (La Niña and neutral conditions) periods in spring and summer and difference of average VPD anomalies between El Niño and non–El Niño periods averaged for all seasons. While the impact of El Niño on North American air temperature is opposite between spring and summer, its impact on North American VPD (and other hydrological variables) is relatively more constant throughout the year (fig. S14).
