
Figure 21.
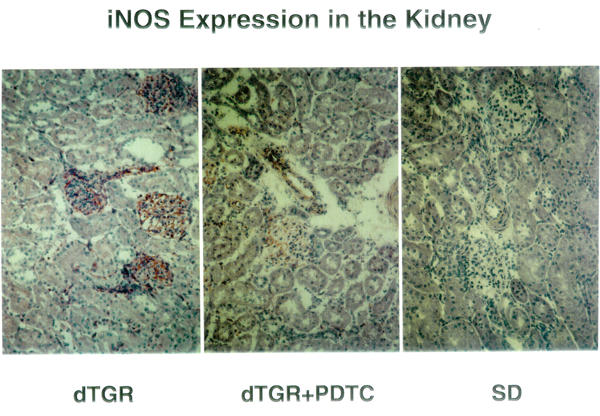
Panel d-f show a representative immunohistochemical photomicrographs of iNOS in the kidney. iNOS expression was increased in glomeruli and the vessel wall of dTGR. PDTC reduced the iNOS expression.
Official websites use .gov
A
.gov website belongs to an official
government organization in the United States.
Secure .gov websites use HTTPS
A lock (
) or https:// means you've safely
connected to the .gov website. Share sensitive
information only on official, secure websites.
Panel d-f show a representative immunohistochemical photomicrographs of iNOS in the kidney. iNOS expression was increased in glomeruli and the vessel wall of dTGR. PDTC reduced the iNOS expression.