
Figure 8.
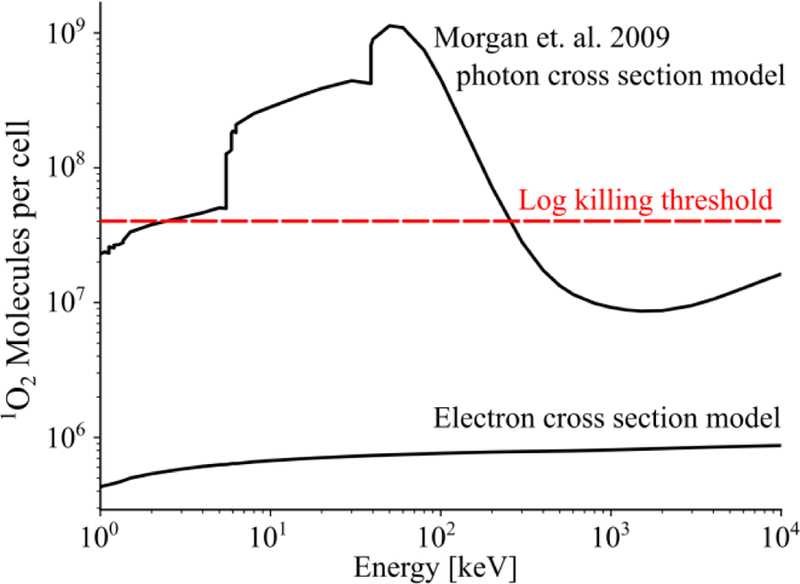
Estimated molecules of O2 generated per cell for a 60 Gy photon dose. Models that use either photon or electron cross secitons are plotted, along with an established log killing threshold (dashed).
Official websites use .gov
A
.gov website belongs to an official
government organization in the United States.
Secure .gov websites use HTTPS
A lock (
) or https:// means you've safely
connected to the .gov website. Share sensitive
information only on official, secure websites.
Estimated molecules of O2 generated per cell for a 60 Gy photon dose. Models that use either photon or electron cross secitons are plotted, along with an established log killing threshold (dashed).