
Figure 5.
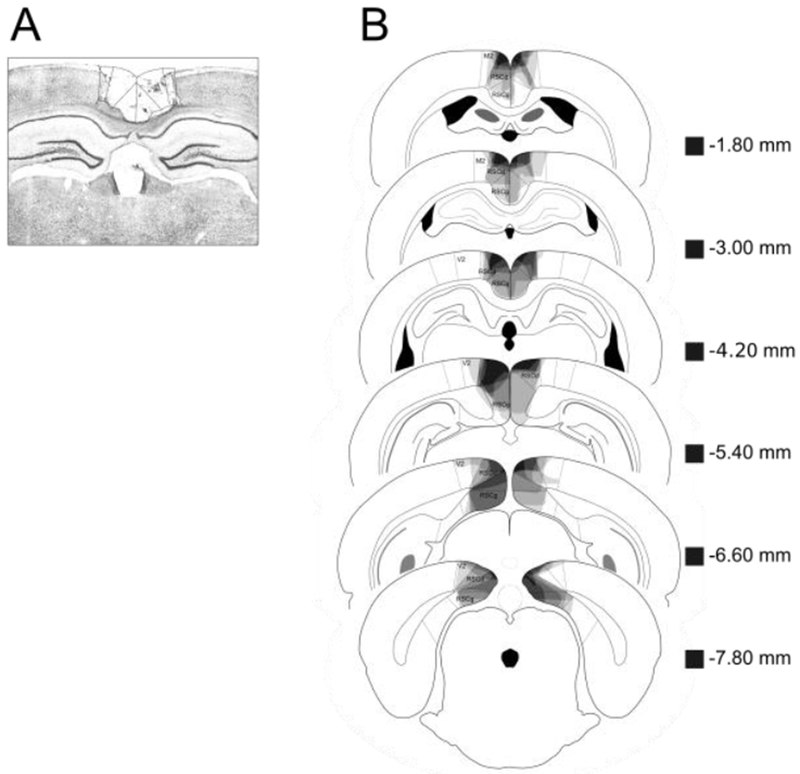
(A) Photomicrograph of a representative RSC lesion. (B) Drawings of lesions at six levels along the rostro-caudal extent of the RSC (−1.8, −3.0, −4.2, −5.4, −6.6, and −7.8 mm posterior to bregma). At each level, lesion drawings were stacked onto a single image. The darkness of an area indicates the number of lesions cases that include that area. Grey boxes (next to the bregma values) represents the expected darkness for overlap from all subjects. M2 = secondary motor cortex, RSCd = retrosplenial dysgranular, RSCg = retrosplenial granula, V2 = secondary visual cortex.